The network for creativity
Join 1.25M professional creatives like you
Connect with clients, get discovered, and run your business 100% commission-free
Creatives on Contra have earned over $150M and we are just getting started
Back to feedPost
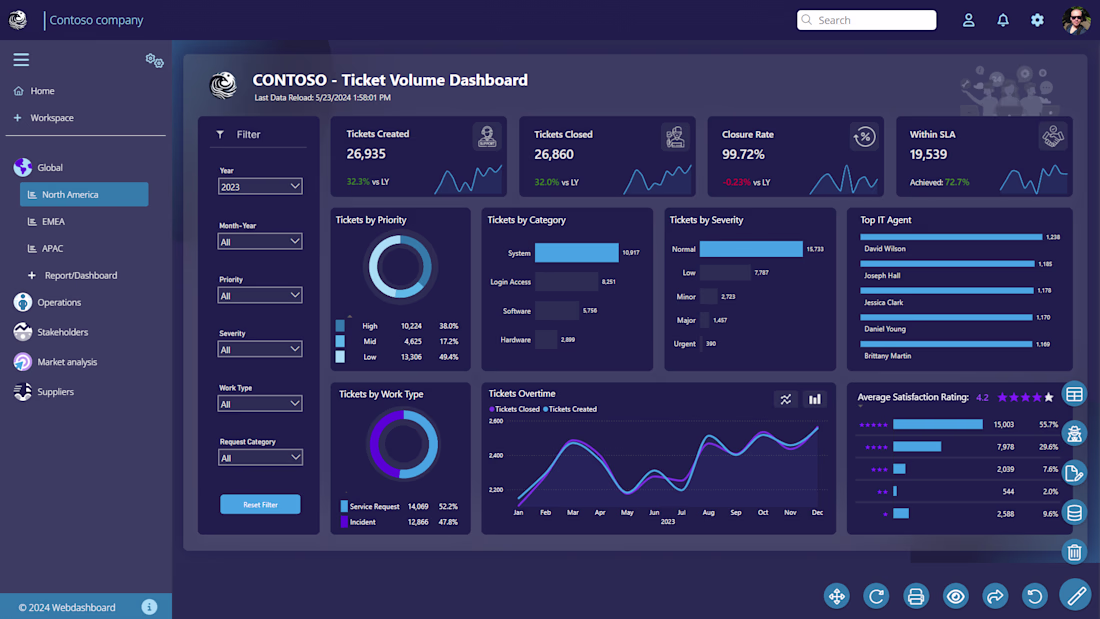
IT Service Management Dashboard Project
Developed an interactive IT Service Management dashboard to monitor ticket volume, incident trends, SLA performance, and support team efficiency. Analyzed operational support data to identify service bottlenecks, improve response times, and support data-driven operational decisions.
Key Business Insights & Decisions:
Monitored ticket creation and closure trends to improve operational efficiency
Identified high-priority and high-severity incidents requiring immediate attention
Tracked SLA compliance rates to reduce delayed ticket resolutions
Analyzed support categories and work types to optimize resource allocation
Evaluated top-performing IT agents based on ticket resolution performance
Improved service quality monitoring through customer satisfaction analysis
Dashboard Highlights:
Ticket Volume & Closure Tracking
SLA Performance Monitoring
Ticket Priority & Severity Analysis
Support Category Breakdown
IT Agent Performance Analysis
Customer Satisfaction Metrics
Interactive Filters for Dynamic Reporting
Skills Used:
Data Cleaning & Transformation
Exploratory Data Analysis (EDA)
KPI Monitoring & Reporting
Operational Data Analysis
Data Visualization
Dashboard Development
Business Intelligence Reporting
Insight-Driven Decision Making
Tools & Technologies:
Power BI • Excel • SQL • Python • DAX • Data Visualization
The network for creativity
Join 1.25M professional creatives like you
Connect with clients, get discovered, and run your business 100% commission-free
Creatives on Contra have earned over $150M and we are just getting started
Related posts
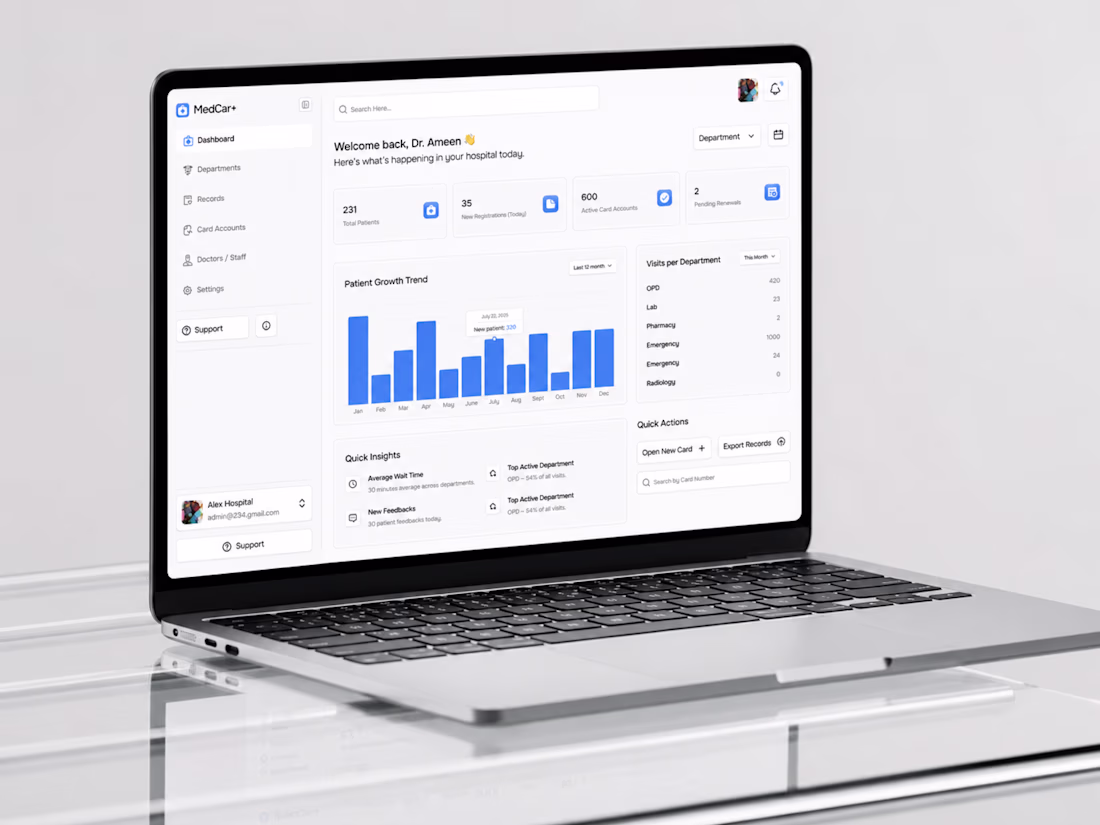
Healthcare Management Dashboard 👇
Check it out
Tools Used
• Figma
• Auto Layout
• Components & Variants
• Design System
• Prototyping
Services
• UI/UX Design
• Product Design
• Dashboard Design
• Web Design
• Mobile App Design
• SaaS Design
Let's create meaningful digital experiences that people love to use. 🚀
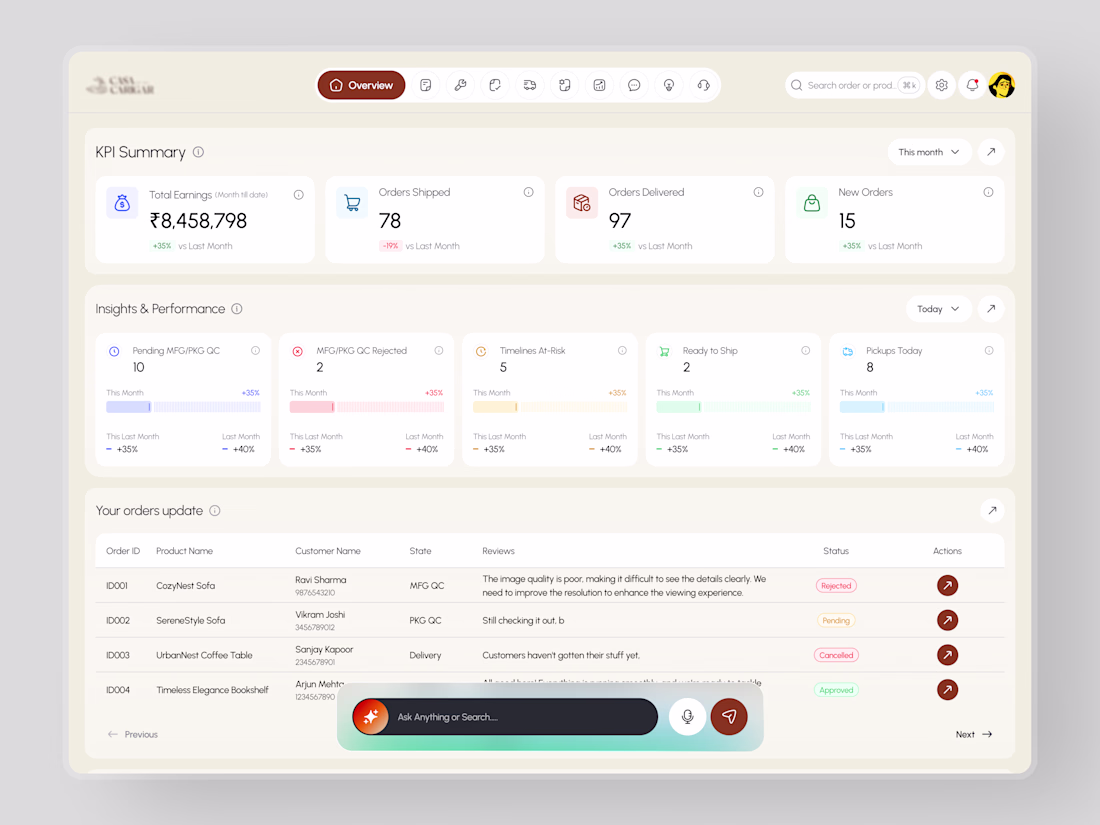
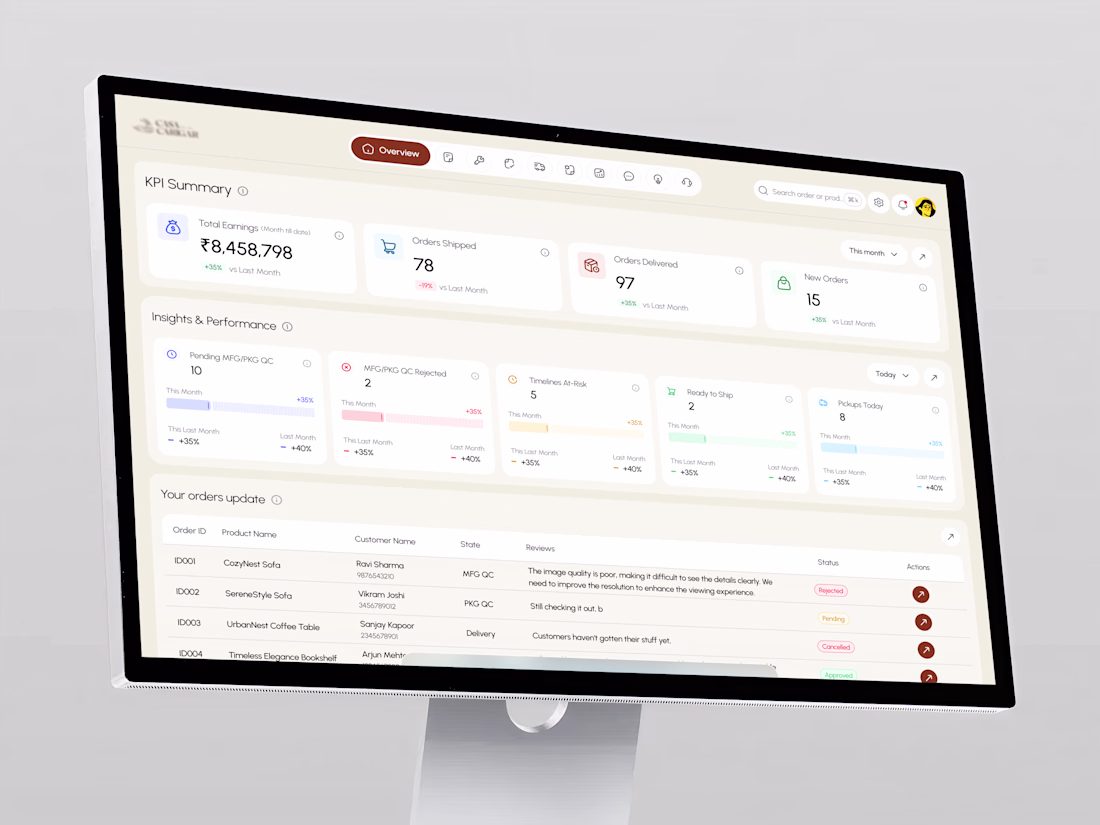
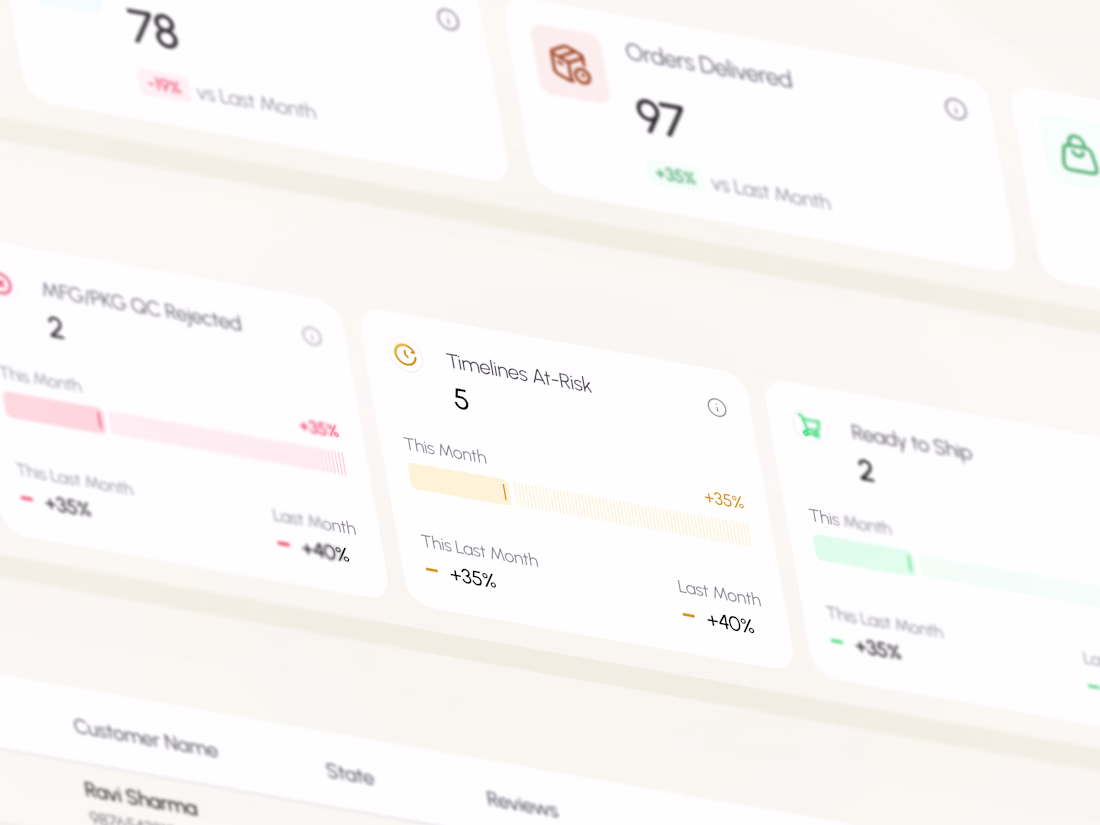
Most e-commerce dashboards show you the data. This one helps you act on it.
KPI summary, insights and performance, QC tracking, order status, and an AI search bar all on one warm, structured screen. Every number compared to last month. Every at-risk timeline flagged before it becomes a problem.
Cream surface. Dark brown accents. Built for the seller who needs to stay ahead of the day.
Does this feel like a dashboard your ops team would actually open first? 👇
Tools: Figma
#DashboardDesign #EcommerceUI #UIDesign #DataDashboard #ContraFreelance #ProductDesign
This look is incredibly polished.
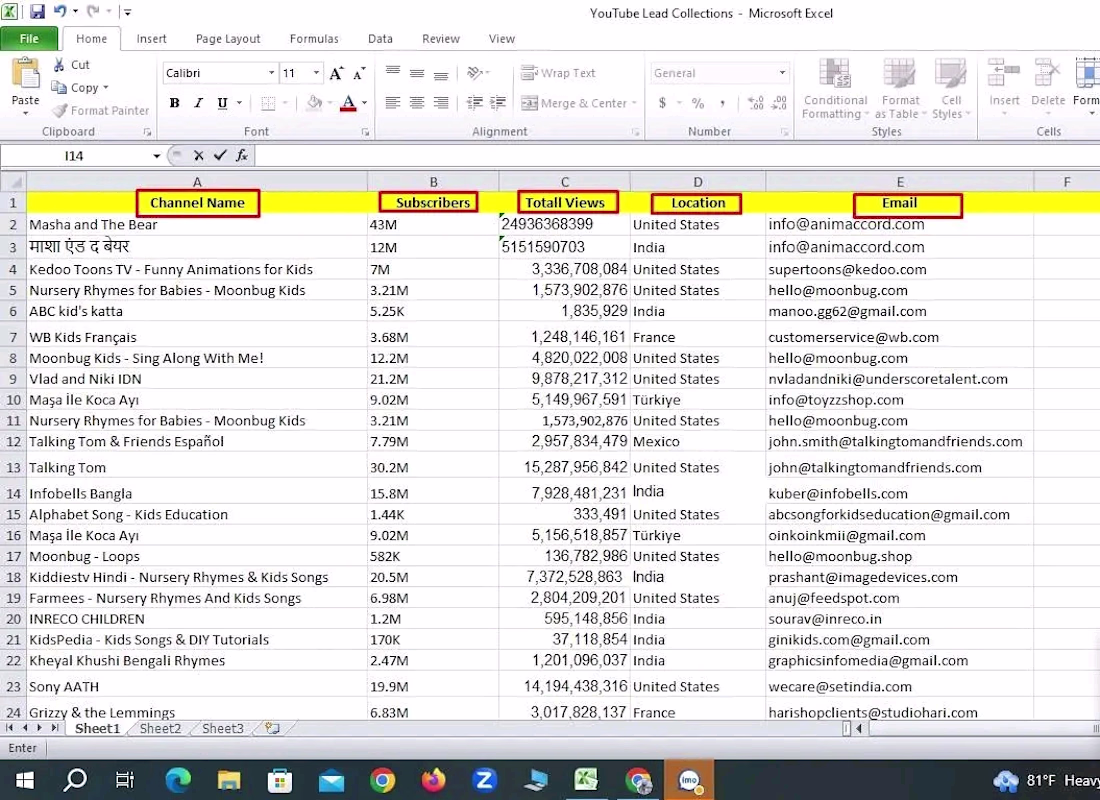
Messy spreadsheets and disorganized records slow your business down. I help founders, small business owners, and busy professionals keep their data clean, accurate, and easy to use from CRM updates to inventory logs to research compilation.
dataentryservicesvirtualassisanceadministrativeassistantData EntryMarket ResearchGoogle DocsMicrosoft Excel
Trending
Claude
Claude has entered the design space. How are you using Claude Design?
Contra University
Learn from expert creatives how to earn more using next-gen AI tools.
MagicPath
The canvas is infinite, and exploration is becoming the workflow. How are you using MagicPath?
creativeaiflow
Creative AI workflows are evolving. What tools do you use, and what are their strengths and weaknesses?
freelancerlife
Freelancer life is wins, pivots, and everything in between. What’s yours right now?