The network for creativity
Join 1.25M professional creatives like you
Connect with clients, get discovered, and run your business 100% commission-free
Creatives on Contra have earned over $150M and we are just getting started
Back to feedPost
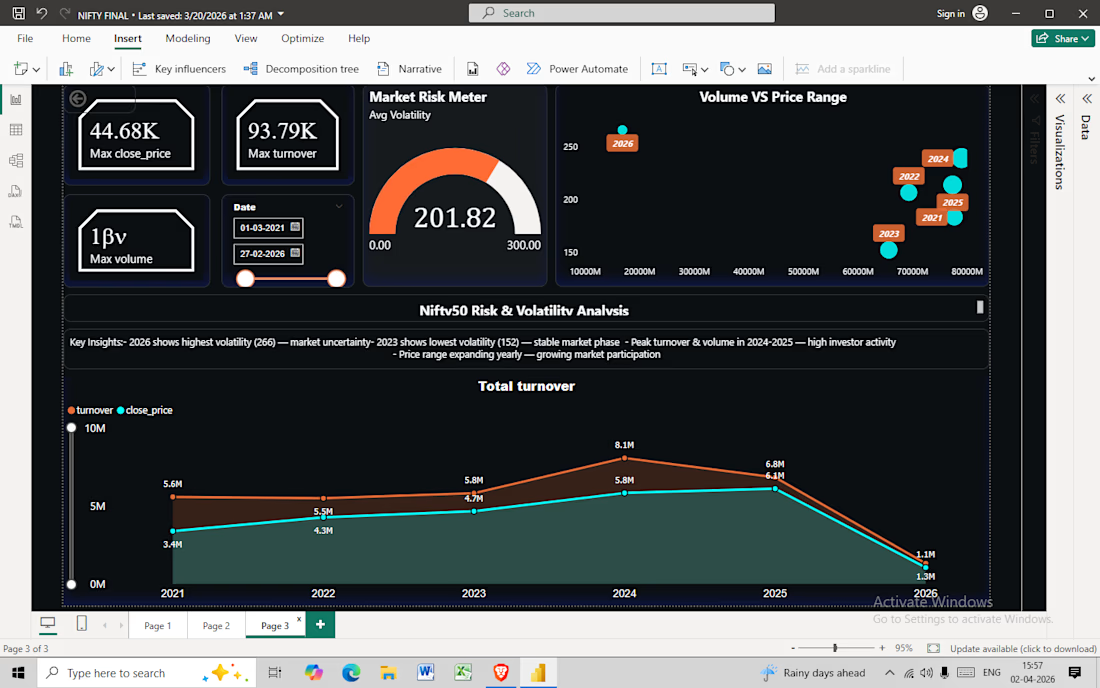
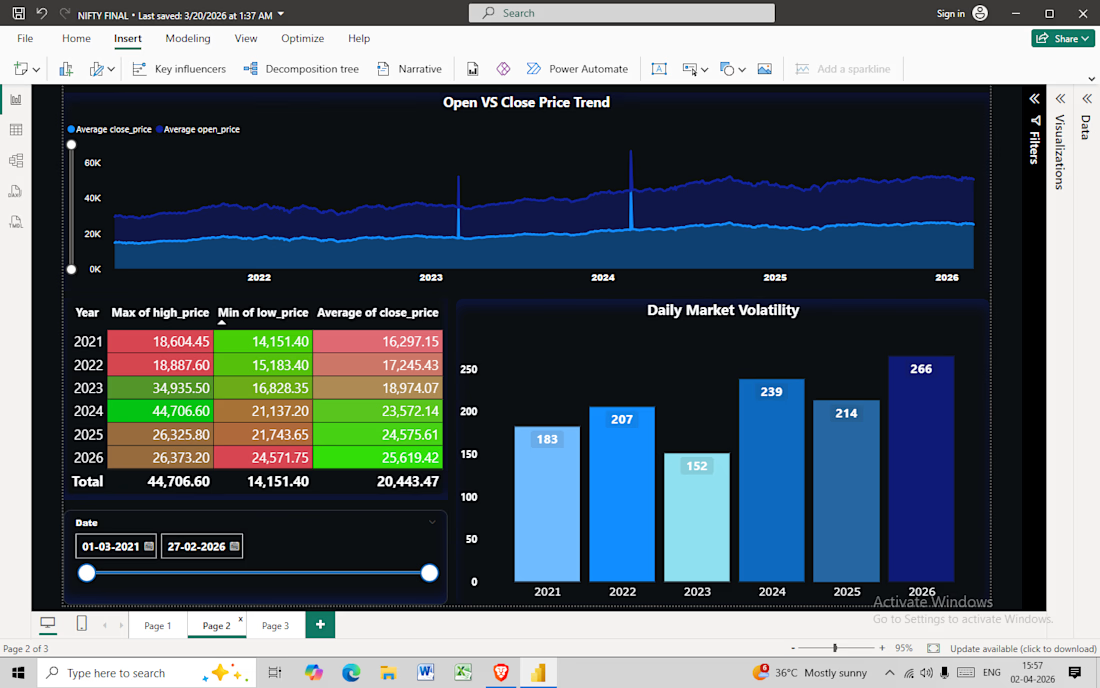
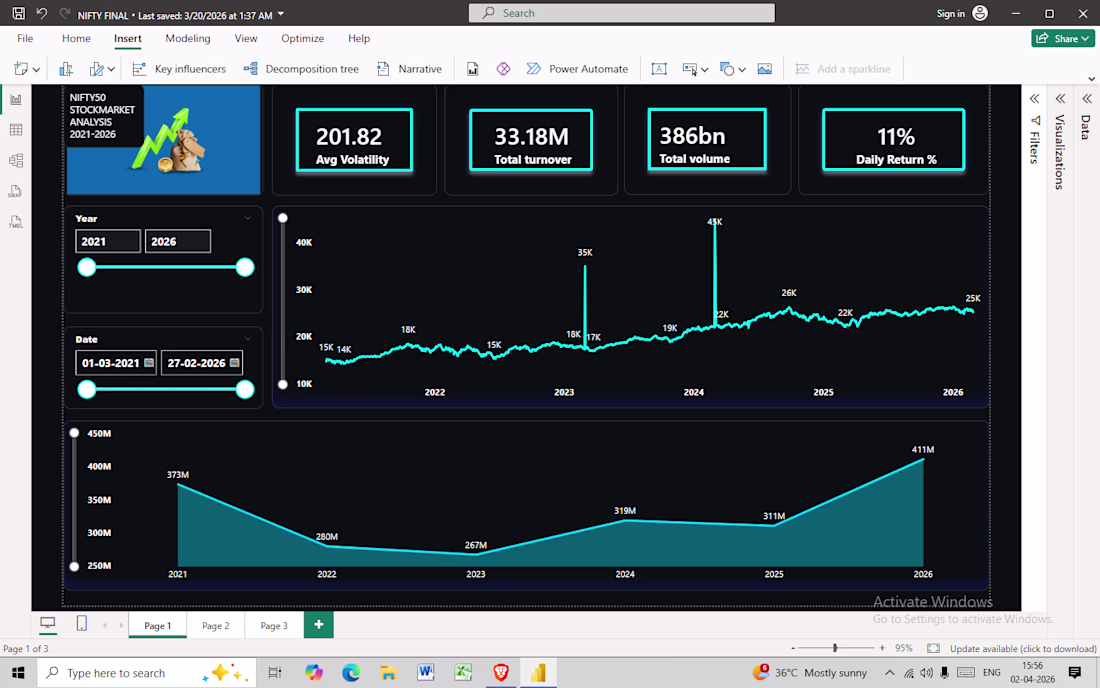
Developed a comprehensive Stock Market Analysis tool using SQL and Power BI to visualize Nifty 50 data.
Data Processing: Cleaned and transformed raw financial datasets using Excel and SQL queries.
Interactive Visuals: Built 3 dynamic dashboards tracking price trends, volatility, and sectoral rotations.
Business Insights: Identified key market drivers and risk factors through historical data analysis.
Financial Expertise: Proven experience in stock market data analysis (Nifty 50).
Tech Stack: Power BI, SQL, Microsoft Excel.
The network for creativity
Join 1.25M professional creatives like you
Connect with clients, get discovered, and run your business 100% commission-free
Creatives on Contra have earned over $150M and we are just getting started
Related posts
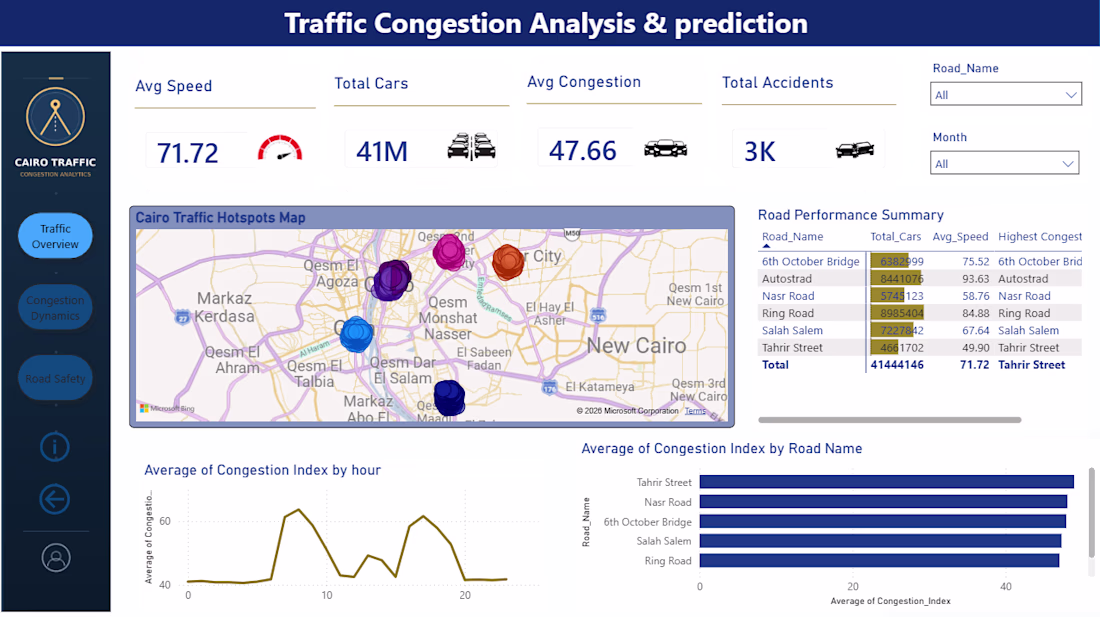
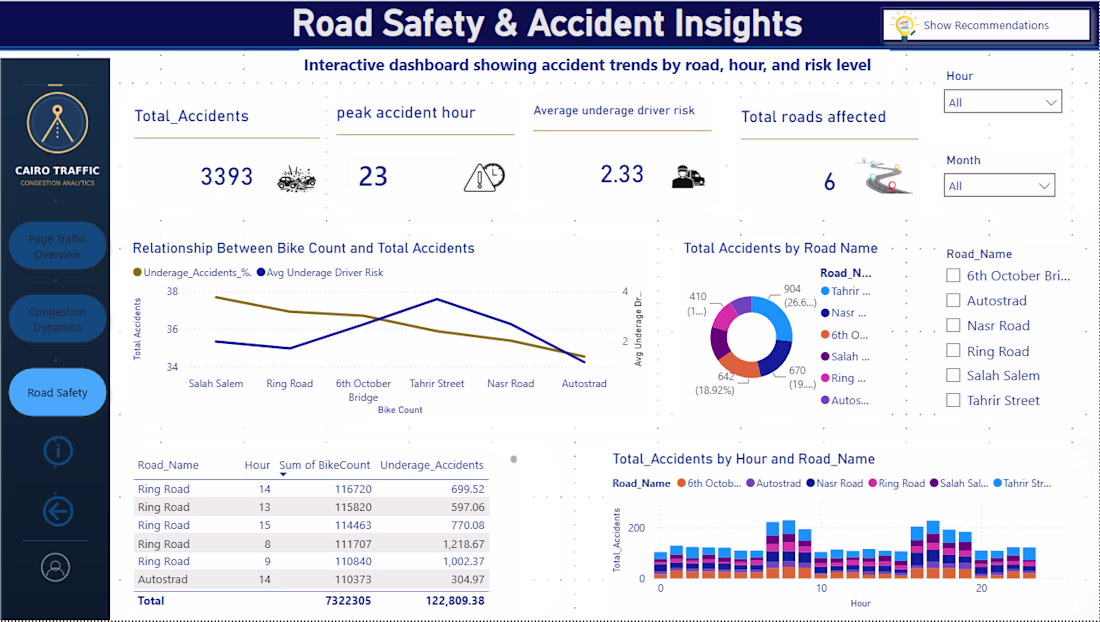
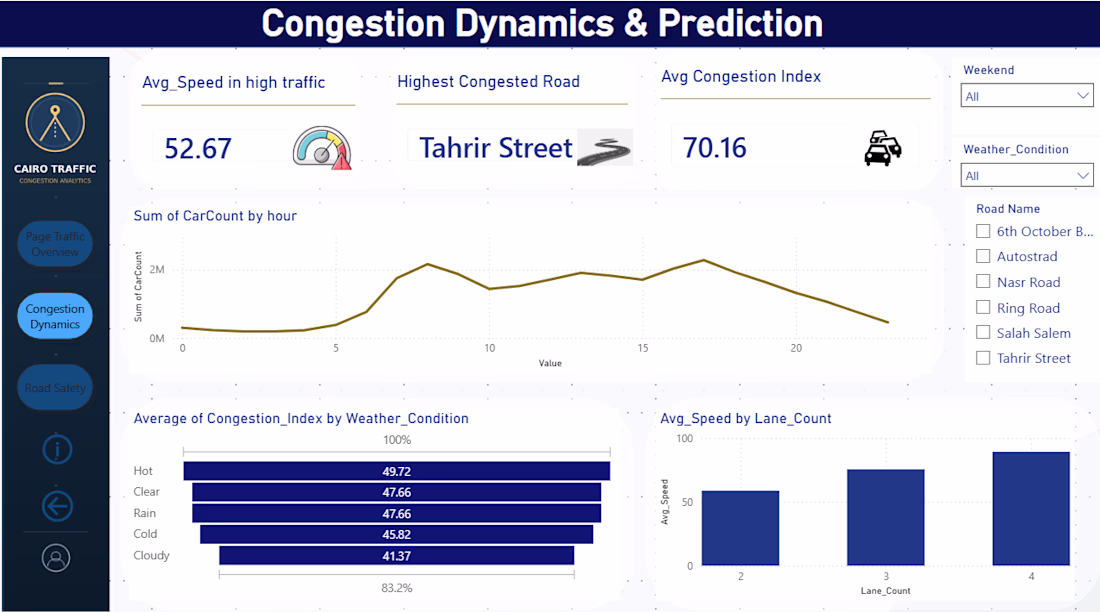
Excited to share my latest data analytics project: Traffic Congestion Analysis & Prediction. 🚗📊
This end-to-end project involved processing complex traffic data to derive actionable insights, including:
Visualizing traffic hotspots and congestion trends across Cairo.
Analyzing accident risk factors related to road types, hours, and underage drivers.
Building an interactive dashboard to support data-driven urban planning.
Tools used: Power BI, DAX, and advanced data visualization techniques.
Check out the snapshots below and let me know your thoughts! Always happy to discuss data-driven solutions. 💡
Access the full project and source code here: [https://github.com/Hazemkhaled278/Traffic-Congestion-Analysis-Prediction- ]
#DataAnalytics #PowerBI #TrafficAnalysis #DataScience #Freelance #Traffic"
The hotspot map alongside the prediction dashboard is a great combo, turns raw congestion numbers into something a city planner could actually act on. Was the traffic data public/open source, or did you have to piece it together from multiple sources?
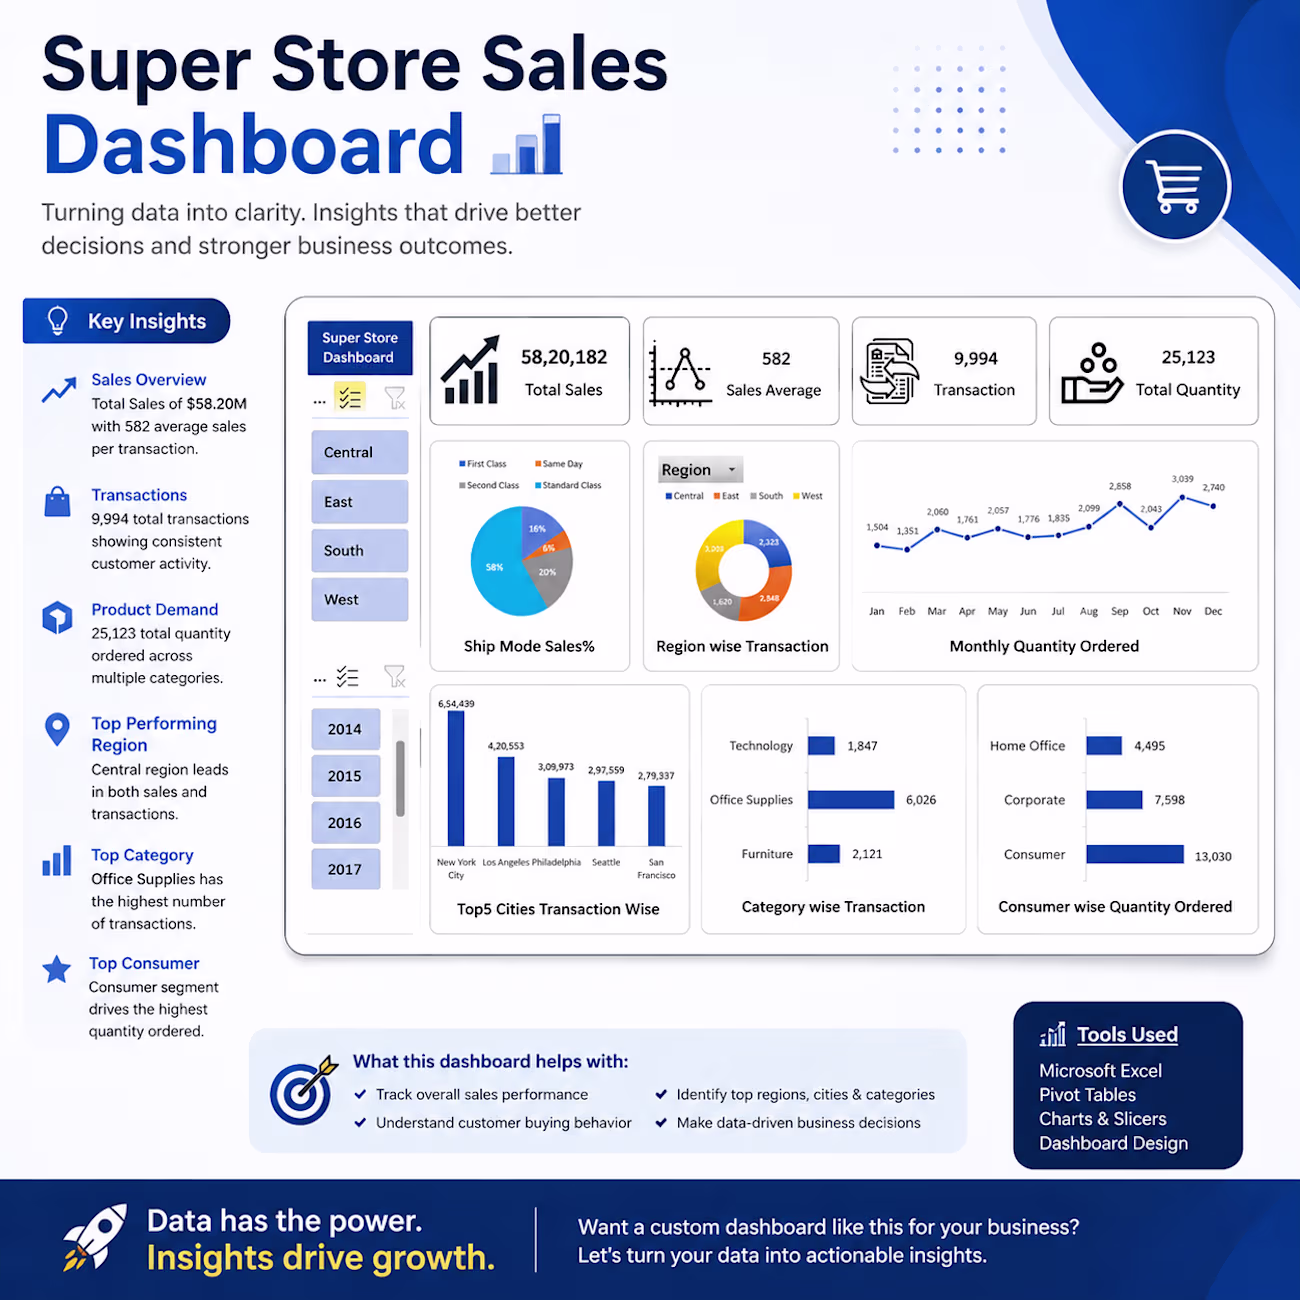
📊 Super Store Sales Dashboard | Microsoft Excel
Data is only valuable when it leads to better decisions.
This project showcases an interactive Excel dashboard designed to transform raw sales data into meaningful business insights. Using Pivot Tables, Pivot Charts, KPI cards, and interactive slicers, the dashboard provides a clear overview of sales performance, customer behavior, and regional trends.
🔍 Key Metrics
• Total Sales: ₹5.82M+
• Total Transactions: 9,994
• Total Quantity Sold: 25,123
• Average Sales per Transaction: ₹582
✨ Dashboard Highlights
• Interactive Region & Year Filters
• KPI Summary Cards
• Monthly Sales & Quantity Trends
• Region-wise Performance Analysis
• Ship Mode Distribution
• Top 5 Performing Cities
• Category-wise Transaction Analysis
• Customer Segment Analysis
• Clean & Executive-Friendly Dashboard Design
💡 Business Value
Rather than displaying data, this dashboard enables stakeholders to quickly answer important business questions, such as:
• Which regions contribute the highest sales?
• Which product categories drive the most transactions?
• How do customer purchasing patterns change over time?
• What trends can support better strategic decisions?
🛠 Tools & Technologies
• Microsoft Excel
• Pivot Tables
• Pivot Charts
• Interactive Slicers
• Dashboard Design
• Data Visualization
This project demonstrates how Excel can be leveraged to build professional, interactive dashboards that simplify complex datasets and support data-driven decision-making.
I'm always looking to solve business problems through data analytics, automation, and visualization.
#DataAnalytics #Excel #Dashboard #BusinessIntelligence #DataVisualization #MicrosoftExcel #ExcelDashboard #Analytics #BusinessAnalytics #PowerBI #SQL #DataDriven #Portfolio
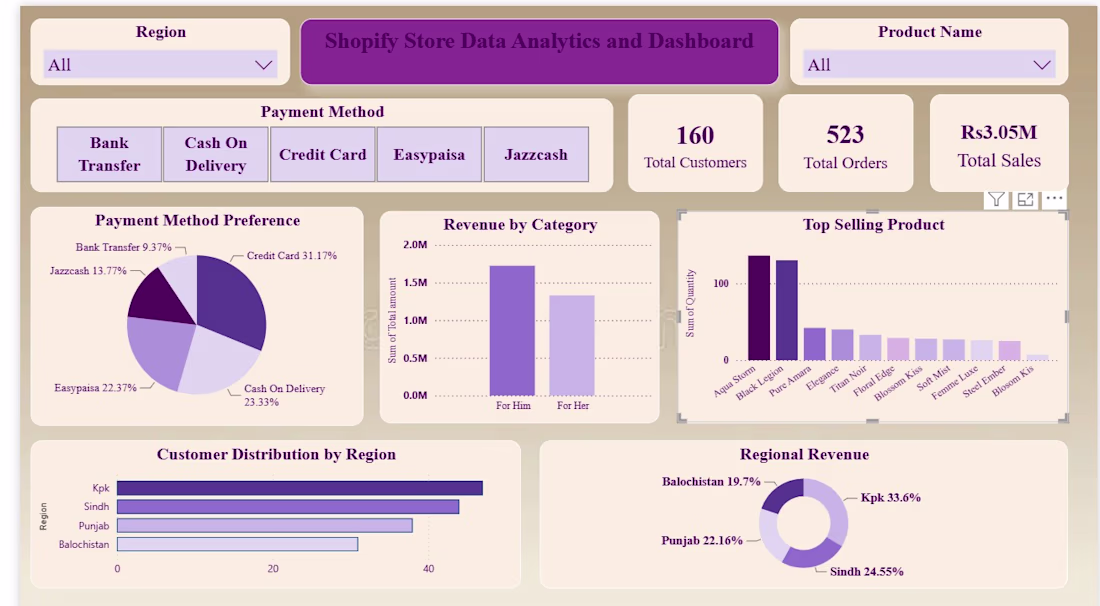
Shopify Store Analytics Dashboard – Power BI
Turning raw Shopify data into actionable business insights.
This interactive dashboard helps businesses monitor:
Total Sales & Orders
Customer Overview
Payment Method Analysis
Top-Selling Products
Regional Revenue & Customer Distribution
Product Category Performance
I build clean, interactive dashboards that help businesses make data-driven decisions with confidence.
If you're looking for a Business Analytics or Power BI freelancer, I'd be happy to help transform your data into meaningful insights.
#PowerBI #Shopify #DataAnalytics #BusinessAnalytics #DashboardDesign #DataVisualization #Freelancer #Contra #Ecommerce #BI
Trending
Claude
Claude has entered the design space. How are you using Claude Design?
Contra University
Learn from expert creatives how to earn more using next-gen AI tools.
creativeaiflow
Creative AI workflows are evolving. What tools do you use, and what are their strengths and weaknesses?
freelancerlife
Freelancer life is wins, pivots, and everything in between. What’s yours right now?