The network for creativity
Join 1.25M professional creatives like you
Connect with clients, get discovered, and run your business 100% commission-free
Creatives on Contra have earned over $150M and we are just getting started
Back to feedPost
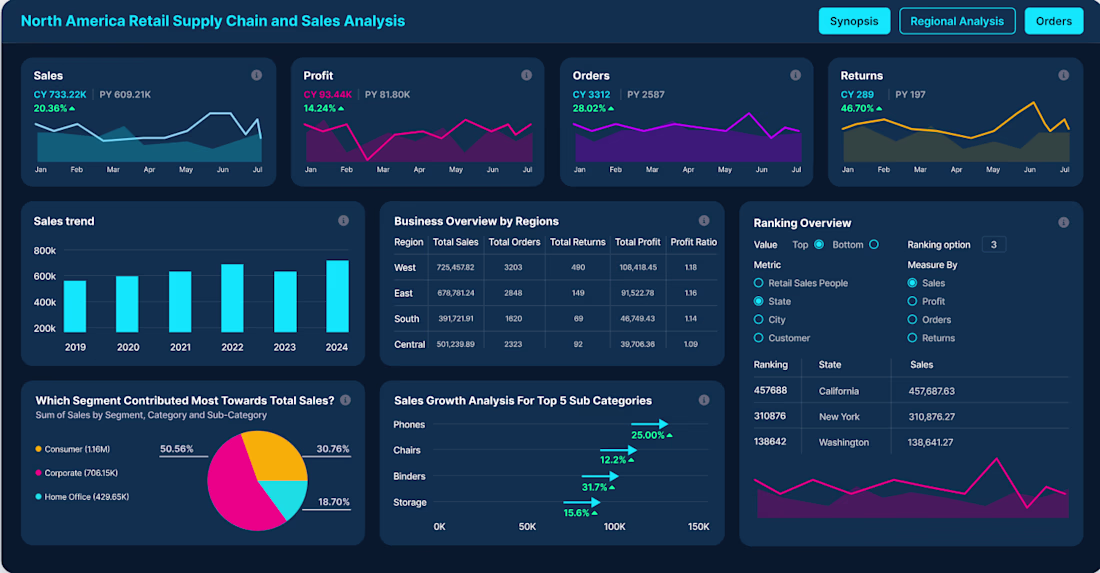
Sales Analysis Dashboard Project
Built an interactive Sales Analysis dashboard to track revenue, sales trends, product performance, and customer purchasing behavior. Analyzed sales data to identify growth opportunities and support data-driven business decisions.
Key Insights:
Identified top-performing products and sales regions
Analyzed monthly sales trends and customer buying patterns
Tracked KPIs to improve sales performance and forecasting
Skills Used:
Data Analysis • KPI Reporting • Data Visualization • Dashboard Development • Business Intelligence
Tools:
Power BI • Excel • SQL • Python
The network for creativity
Join 1.25M professional creatives like you
Connect with clients, get discovered, and run your business 100% commission-free
Creatives on Contra have earned over $150M and we are just getting started
Related posts
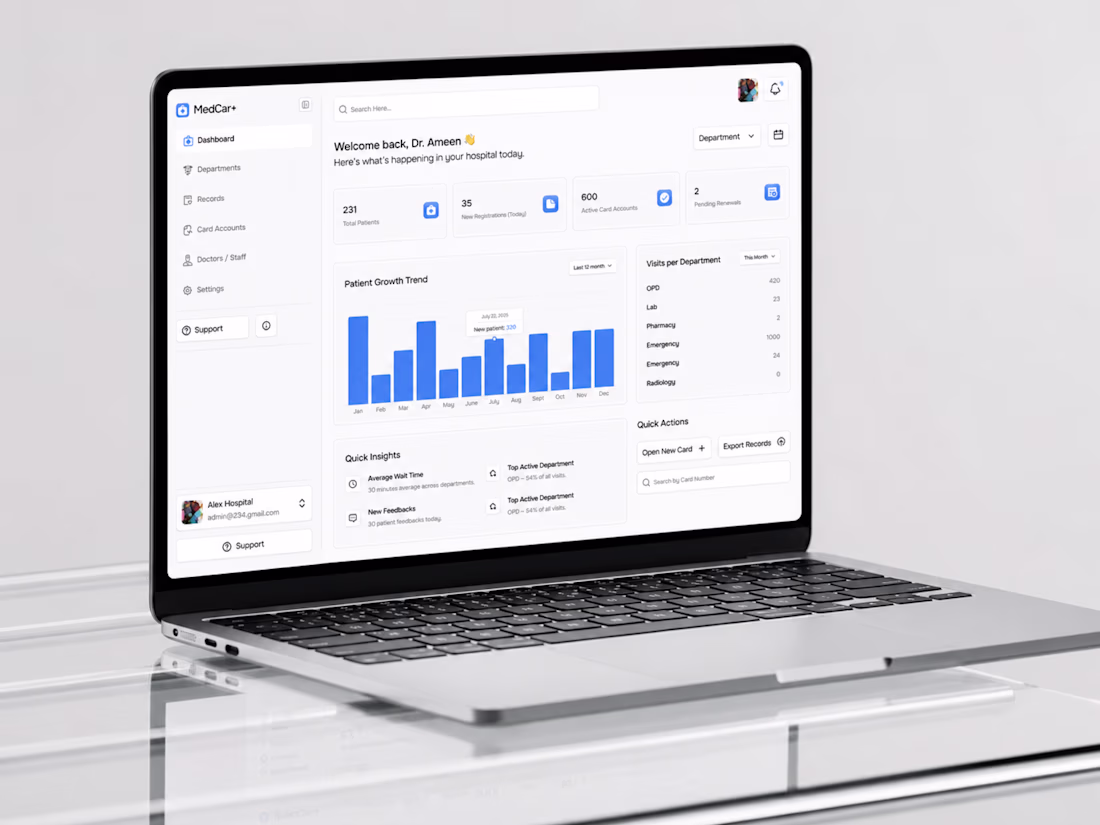
Healthcare Management Dashboard 👇
Check it out
Tools Used
• Figma
• Auto Layout
• Components & Variants
• Design System
• Prototyping
Services
• UI/UX Design
• Product Design
• Dashboard Design
• Web Design
• Mobile App Design
• SaaS Design
Let's create meaningful digital experiences that people love to use. 🚀
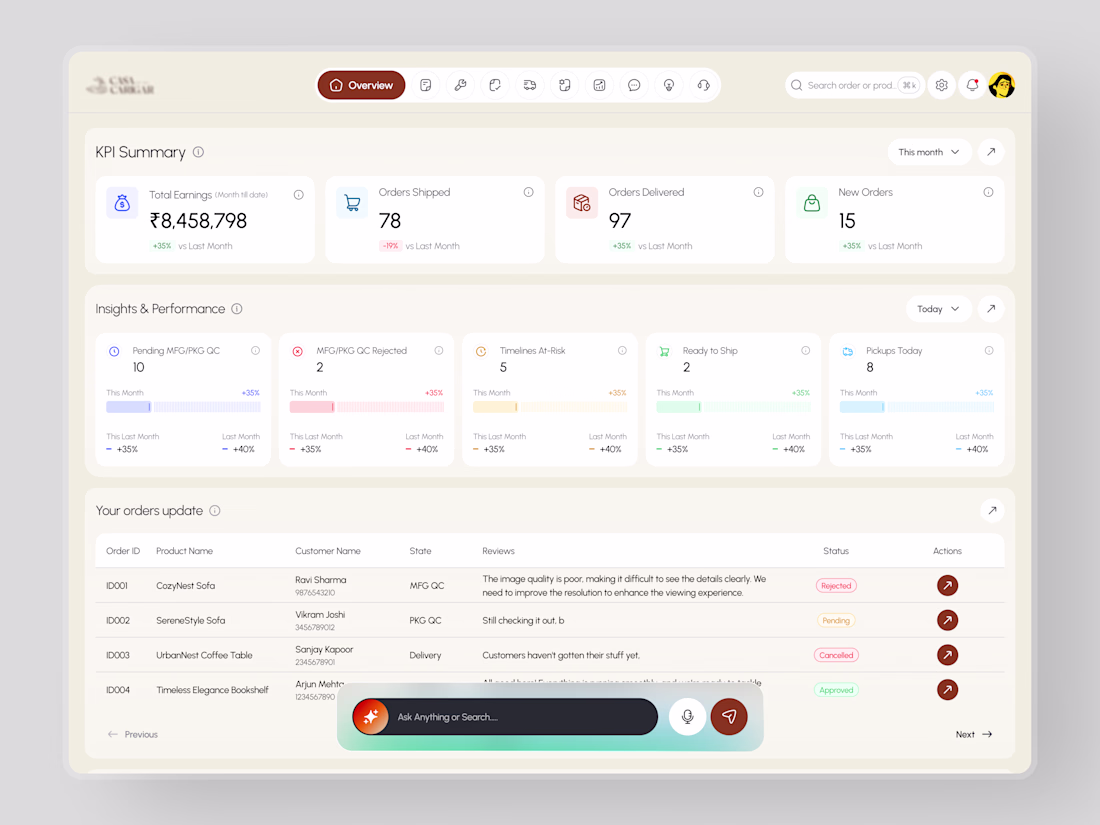
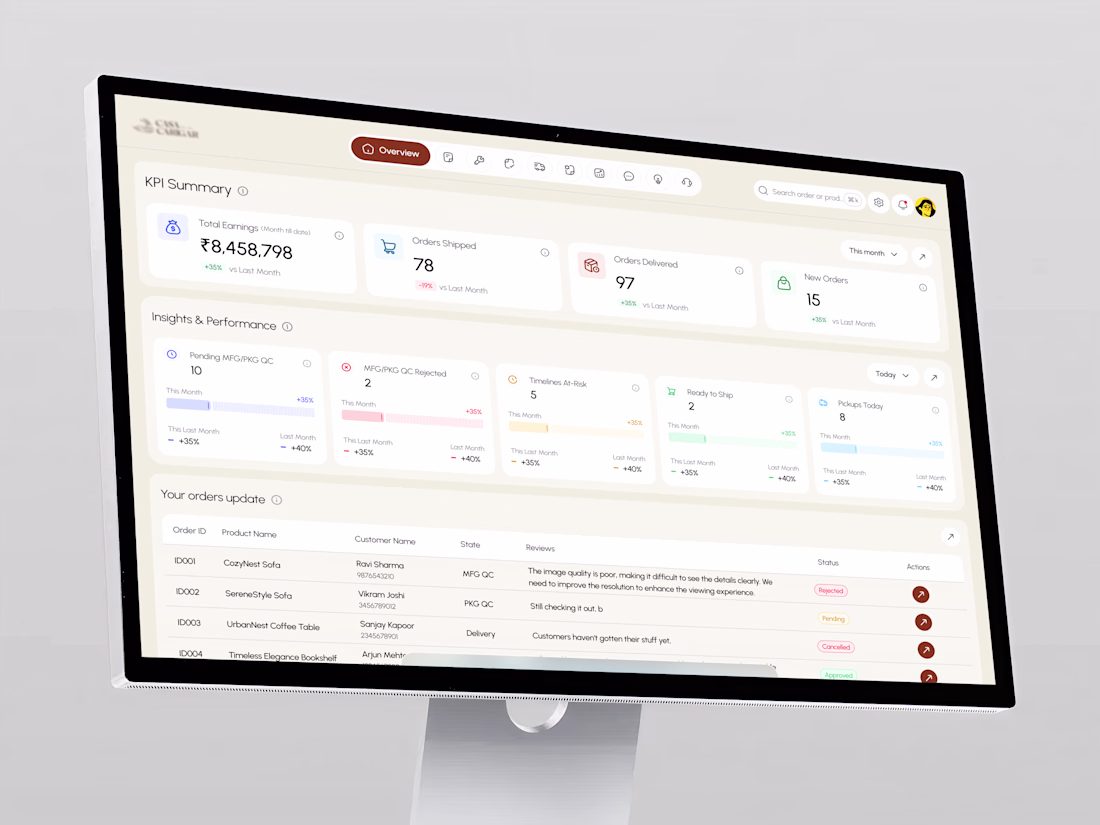
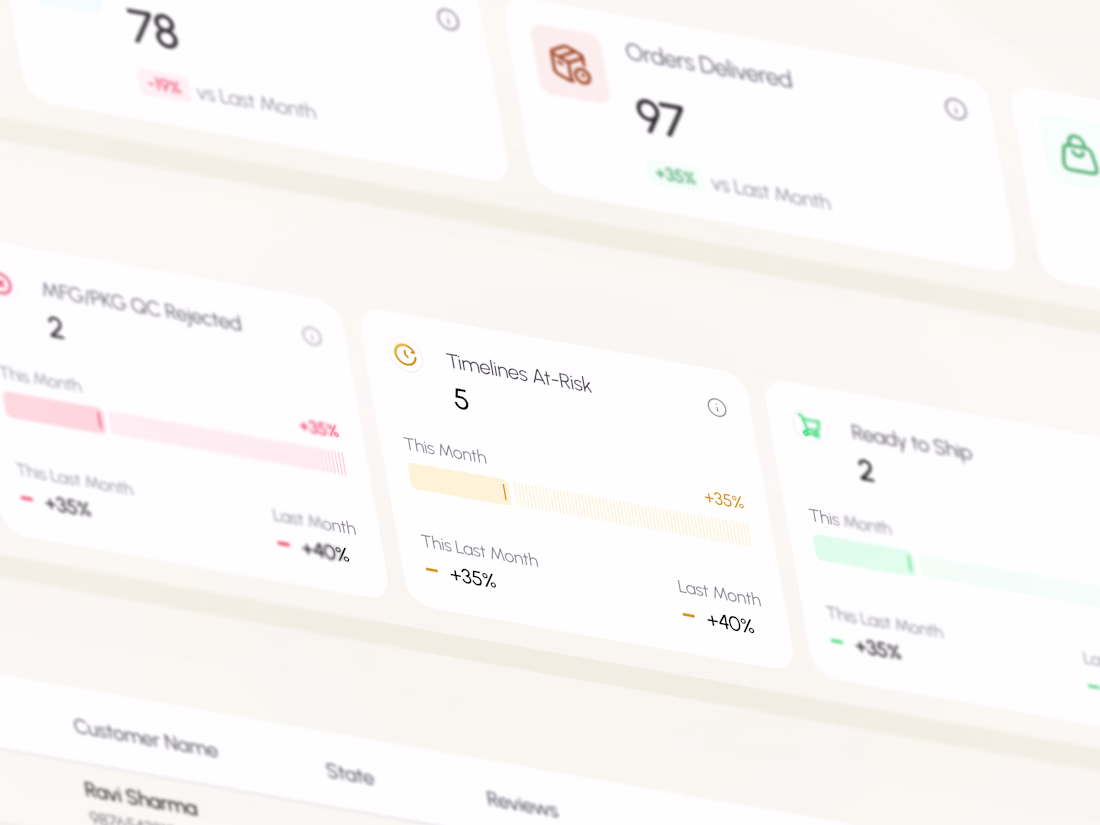
Most e-commerce dashboards show you the data. This one helps you act on it.
KPI summary, insights and performance, QC tracking, order status, and an AI search bar all on one warm, structured screen. Every number compared to last month. Every at-risk timeline flagged before it becomes a problem.
Cream surface. Dark brown accents. Built for the seller who needs to stay ahead of the day.
Does this feel like a dashboard your ops team would actually open first? 👇
Tools: Figma
#DashboardDesign #EcommerceUI #UIDesign #DataDashboard #ContraFreelance #ProductDesign
This look is incredibly polished.
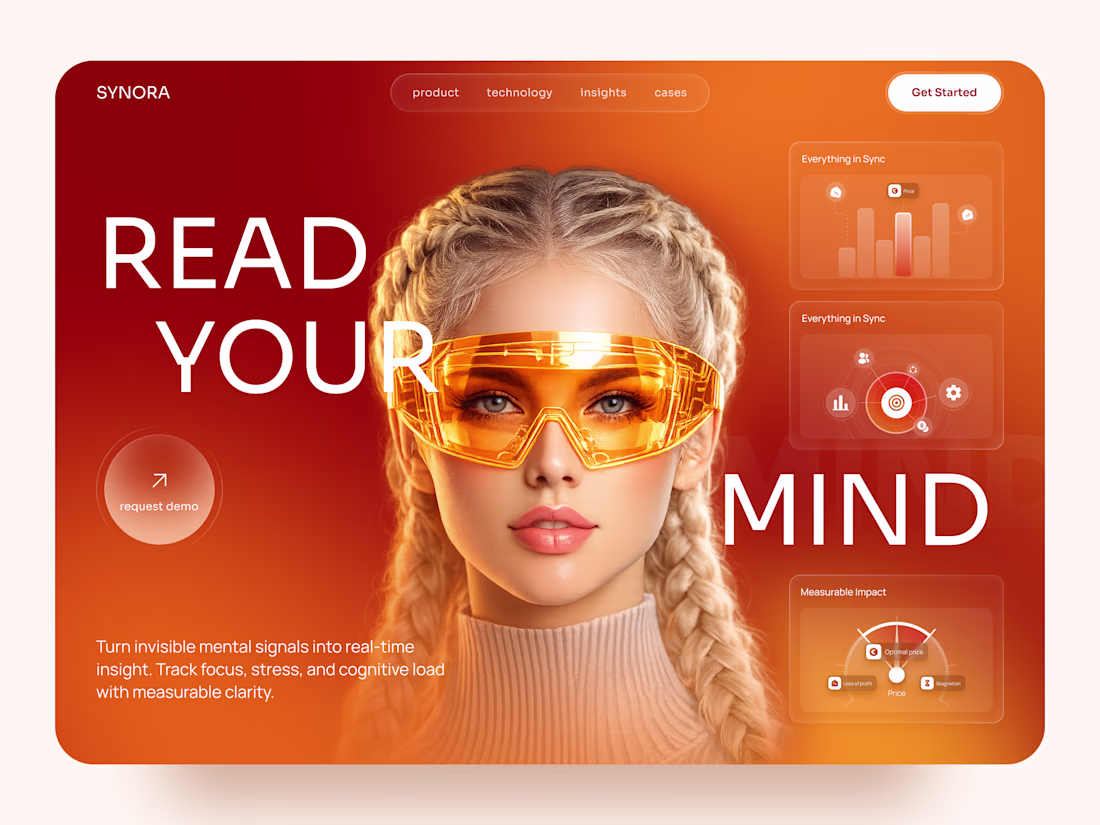
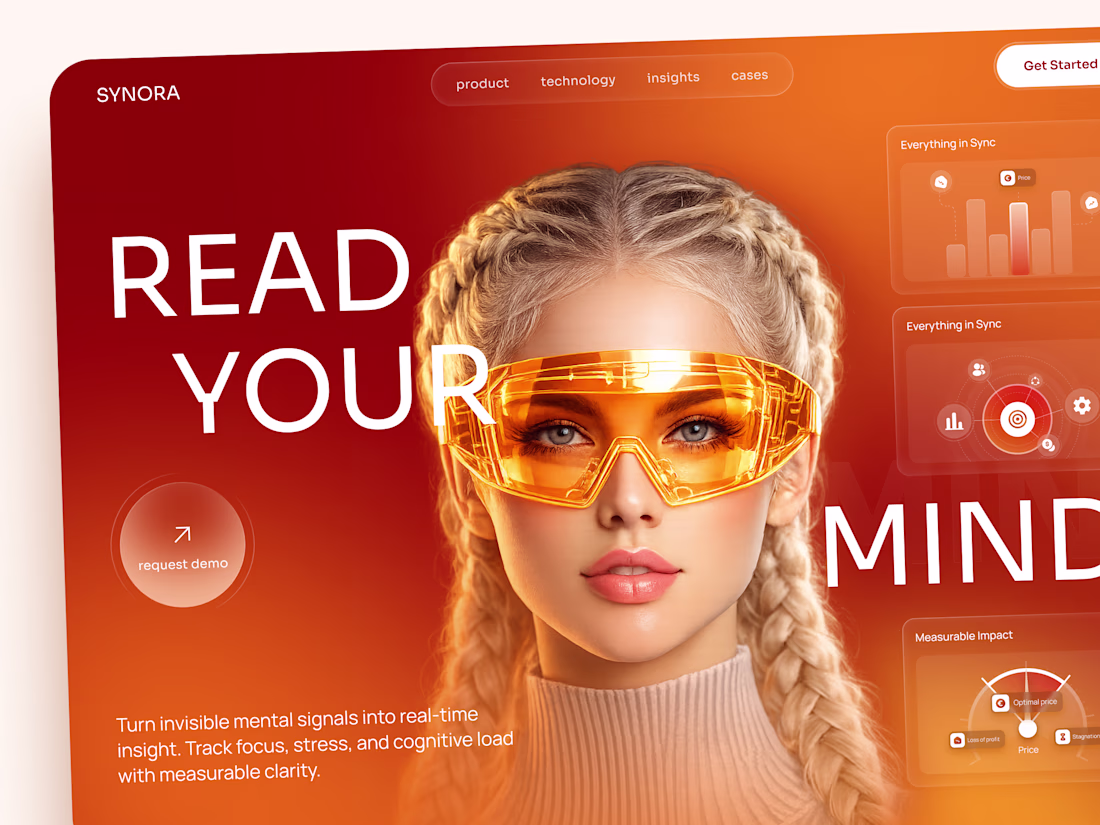
Synora — AI-Powered Neurotech Experience for Cognitive Insights 🧠
We designed a futuristic digital experience for Synora ⚡— a concept platform that transforms invisible mental signals into actionable, real-time insights.
The challenge was to communicate complex cognitive data through a visually striking interface that feels both cutting-edge and approachable. By combining immersive visuals, bold typography, and transparent UI layers, we created an experience that bridges advanced neuroscience and everyday usability.
Special attention was given to:
• a cinematic hero experience centered around wearable neurotechnology and biometric intelligence;
• bold editorial typography that reinforces the product's futuristic positioning and creates immediate visual impact;
• data visualization cards designed to surface cognitive metrics, focus levels, stress indicators, and performance signals at a glance;
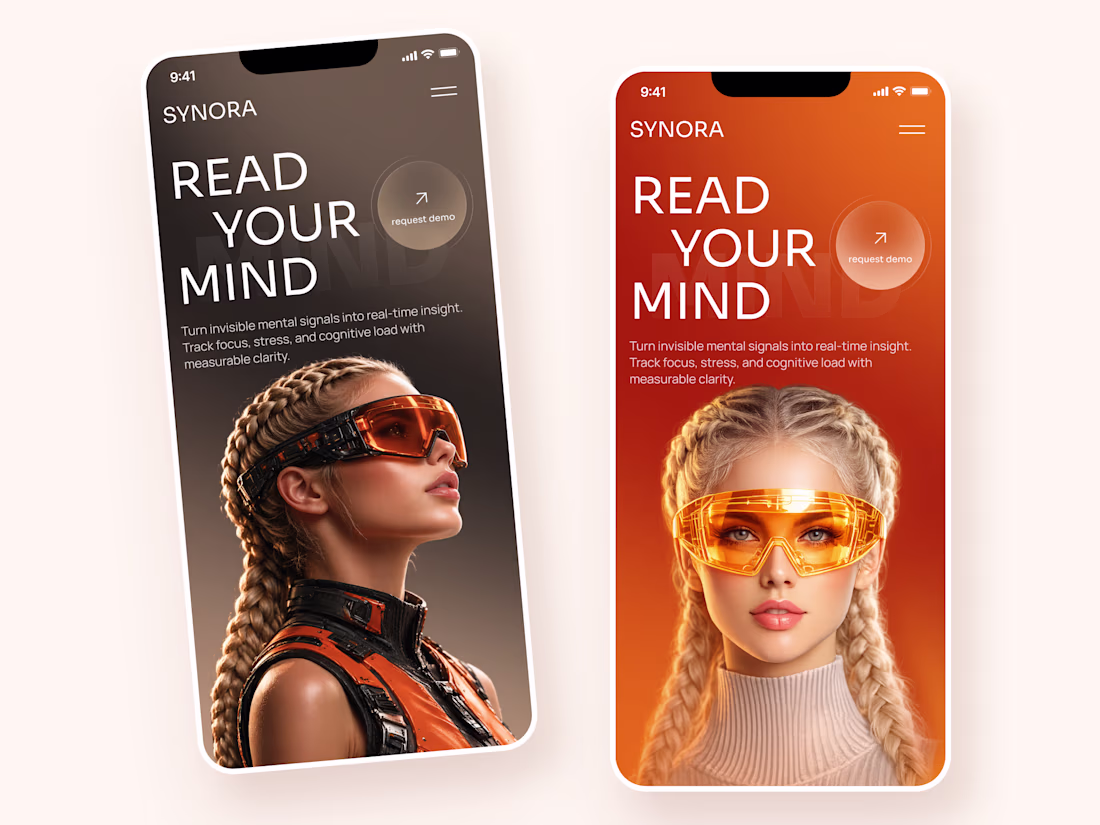
• responsive mobile experiences optimized for product demos, investor presentations, and early user acquisition;
• a premium visual language combining warm gradients, glassmorphism effects, and high-end 3D imagery;
• a scalable design system ready to support future dashboard modules and AI-powered insights.
The result is a memorable digital experience that helps an emerging technology feel tangible, trustworthy, and easy to understand — turning complex cognitive science into a product users can immediately connect with.
Looking to design a bold digital experience for your AI, Healthcare, NeuroTech, or SaaS product? Let's build something remarkable together! 🚀
Trending
Claude
Claude has entered the design space. How are you using Claude Design?
Contra University
Learn from expert creatives how to earn more using next-gen AI tools.
MagicPath
The canvas is infinite, and exploration is becoming the workflow. How are you using MagicPath?
creativeaiflow
Creative AI workflows are evolving. What tools do you use, and what are their strengths and weaknesses?
freelancerlife
Freelancer life is wins, pivots, and everything in between. What’s yours right now?