Senior Data Analyst | Business Intelligence Consultant
View more →
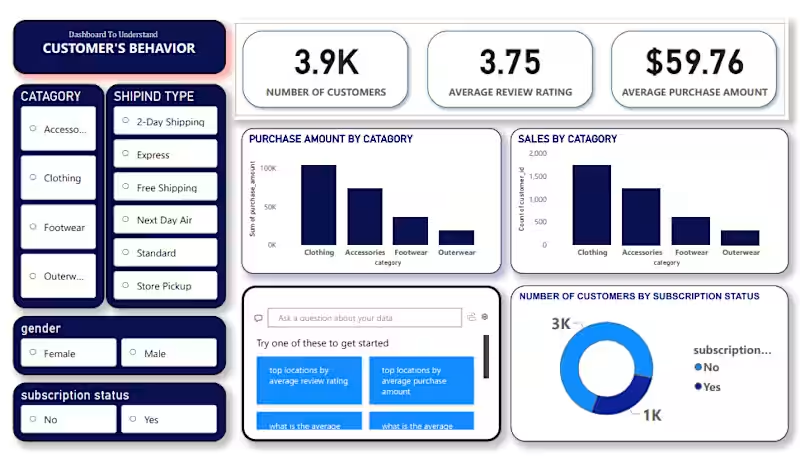
Power BI Expert | Turning Raw Data into Actionable Insights
New to Contra
Power BI Expert | Turning Raw Data into Actionable Insights
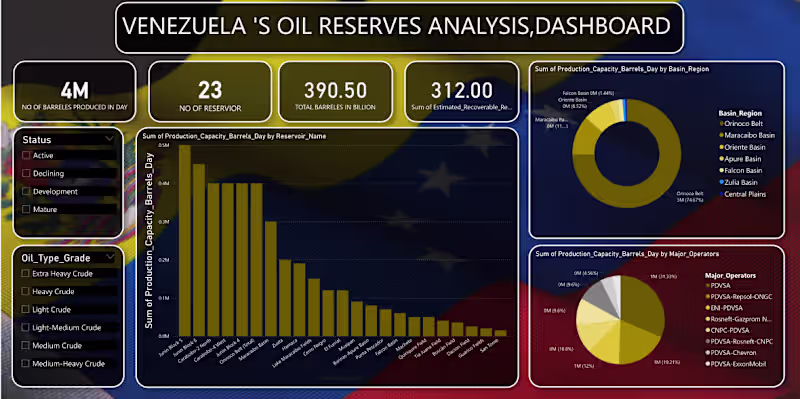
MS PowerBI certified DataAnalyst | Get results, improvements
MS PowerBI certified DataAnalyst | Get results, improvements
View more →
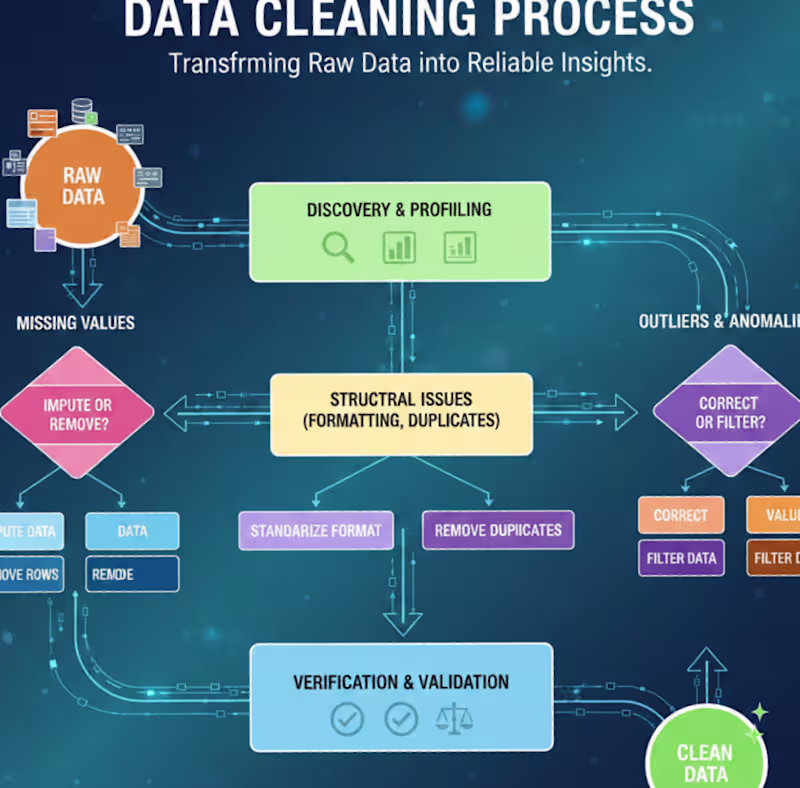
Data Analyst | Transforming raw data into clear insights.
Data Analyst | Transforming raw data into clear insights.
Data-Driven Strategies for Success
Data-Driven Strategies for Success


View more →
Data Analyst: Transforming Insights 📊
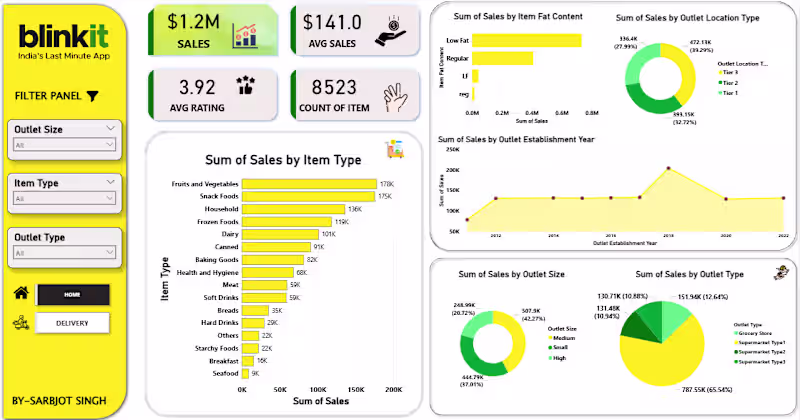
Expert Data Analyst & Machine Learning Specialist | Python
Expert Data Analyst & Machine Learning Specialist | Python

View more →
Data Insights with Python & SQL Expertise
Data Insights with Python & SQL Expertise
View more →