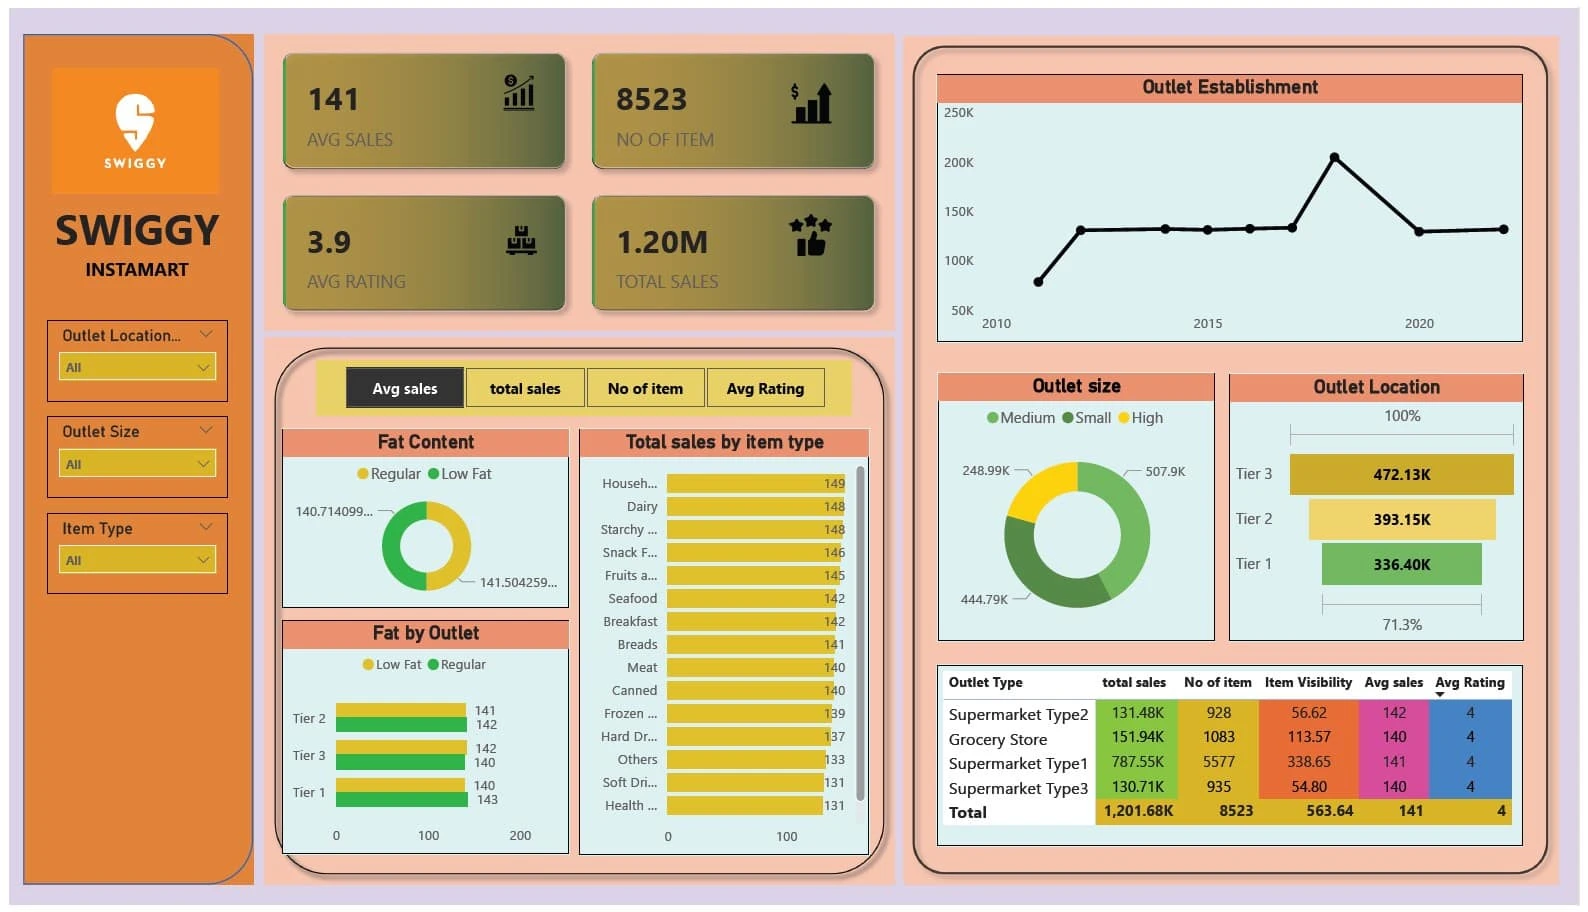
Swiggy Instamart Sales Dashboard
VARSHA ZOKE
KPI’s Requirements:
1. Total sales: the overall revenue generated from all items sold.
2. Average sales: the average revenue per sale.
3. Number of item: the total count of different items sold.
4. Average rating: the average customer rating for items sold.
Steps in project:
1. Requirement gathering / business requirements
2. Data walkthrough
3. Data connection
4. Data cleaning / quality check
5. Data modeling
6. Data processing
7. DAX calculations
8. Dashboard lay outing
9. Charts development and formatting
10. Dashboard / report development
11. Insights generation
Business Requirement:
1. Total sales by fat content:
Objective: analyze the impact of fat content on total sales.
Additional KPI metrics: assess how other KPI’s (average sales, number of items, average rating) vary with fat content.
Chart type: donut chart
2. Total sales by item type:
Objective: identify the performance of different item types in terms of total sales.
Additional KPI metrics: assess how other KPI’s (average sales, number of items, average rating) vary with fat content.
Chart type: bar chart
3. Fat content by outlet for total sales:
Objective: compare total sales across different outlets segmented by fat content
Additional KPI metrics: assess how other KPI’s (average sales, number of items, average rating) vary with fat content.
Chart type: stacked column chart
4. Total sales by outlet establishment:
Objective: evaluate how the age or type of outlet establishment influence total sales.
Chart type: line chart.
5. Sales by outlet size:
Objective: analyze the correlation between outlet size and total sales.
Chart type: Donut / Pie chart
6. Sales by outlet location:
Objective: assess the geographic distribution of sales across different locations.
Chart type: funnel map.
7. All metrics by outlet type:
Objective: provide a comprehensive view of all key metrics (total sales, average sales, number of items, average rating) broken down by different outlet types.
Chart type: matrix card.
Swiggy Instamart Sales Dashboard
Like this project
Posted Dec 20, 2024
This project was about Swiggy Instamart Sales Dashboard by client located in Mumbai who is one of biggest food delivery app for Metro cities in India.
Likes
0
Views
81