Cricket WorldCup Dashboard
VARSHA ZOKE
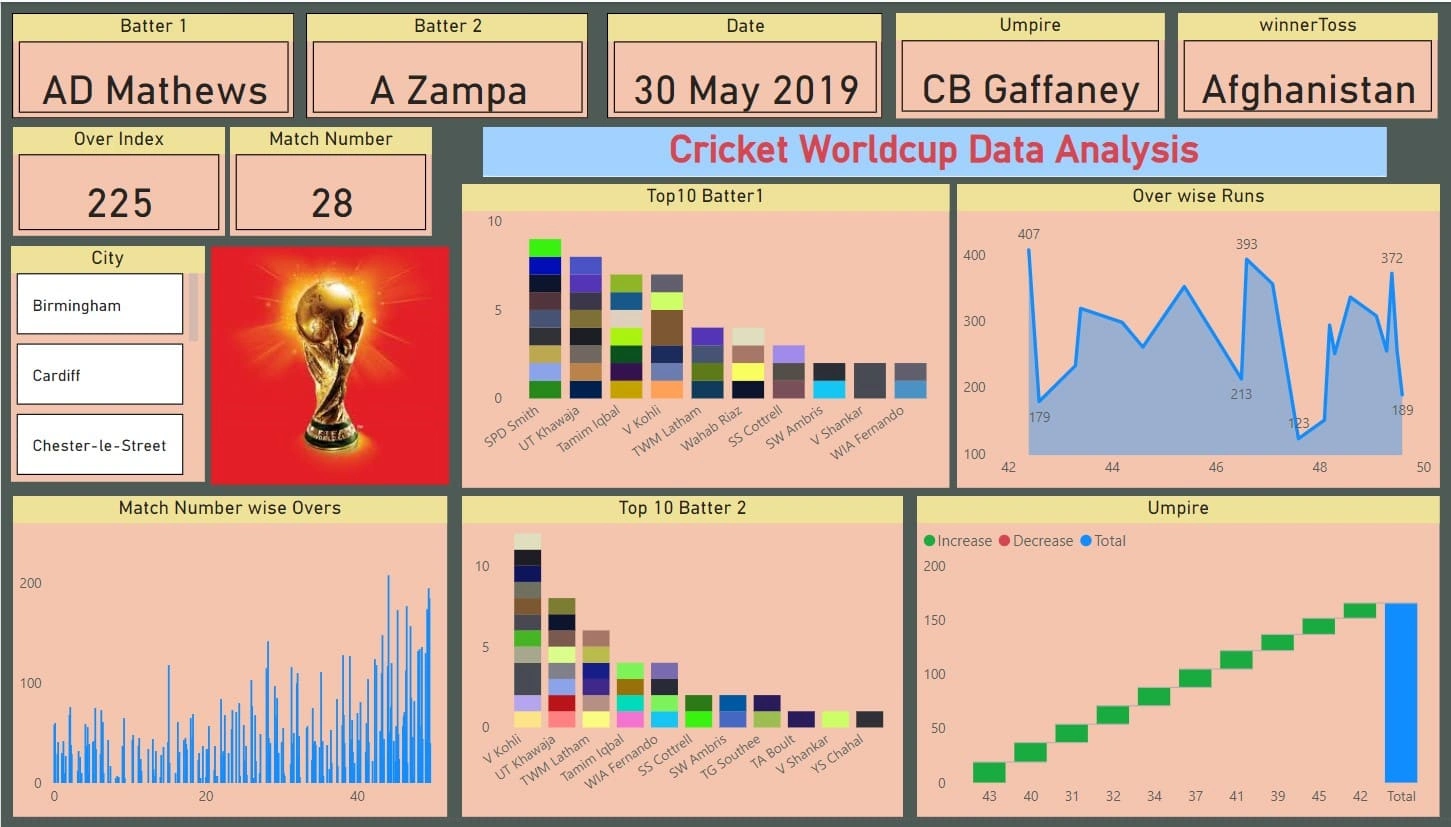
The World Cup dashboard features various cards and graphs, including cards for Batter 1 and Batter 2, Date of Matches, Umpire, Winning Toss, Over Index and Match Number, along with corresponding graphs to visualize the match data. The City card displays the location where the match took place.
Graphs : stacked column charts are used to display the top 10 Batter 1 and top 10 Batter 2, with each chart showing their respective performances. The area chart displays runs scored over each over, while the waterfall chart shows the activities of different umpires throughout the match.The stacked column charts display overs by match number.
WorldCup Dashboard
Like this project
Posted Dec 21, 2024
Cricket WorldCup Dashboard created overall performance of Batsman and city wise match details.
Likes
0
Views
8