
OBJECTIVE
Organization wants to improve employee performance and improve employee retention and reduce attrition by creation a HR Analytics dashboard.
Data was imported from a CSV file which was processed for Data Cleaning and we have Removed unwanted columns AND Removed duplicate values.
Steps in project:
1. Requirement gathering / business requirements
2. Data walkthrough
3. Data connection
4. Data cleaning / quality check
5. Data modeling
6. Data processing
7. DAX calculations
8. Dashboard lay outing
9. Charts development and formatting
10. Dashboard / report development
11. Insights generation
KPI’s Requirements:
Cards
1. Count of Employee:
2. Attrition: Attrition field have value as Yes and No. after creating attrition count from conditional column formatting the value gets converted into 1 and 0.
3. Attrition Rate: create measure
Attrition Rate= sum(attrition count)/ sum(employee count)
4. Average age:
5. Average of monthly income (salary)
6. Average Year: Years at company
Graphs
1. Attrition By Education: Sum of attrition count by education field
Chart type: donut chart
2. Attrition By Age: Create age group from conditional column formatting as 18-25, 26-35, 36-45, 46-55, 55+
Chart type: Stacked column chart
3. Attrition By Salary Slab: Salary slab by sum of attrition count
Chart type: Stacked Bar chart
4. Attrition By Years at Company: Years at company by sum of attrition count:
Chart type: Area chart
5. Attrition By Job Role: Job role by sum of attrition count:
Chart type: Stacked column chart
6. Attrition By Gender: Gender by sum of attrition count:
Chart type: Tree map
Matrix table
1. Table created from Job role ,attrition count and job satisfaction
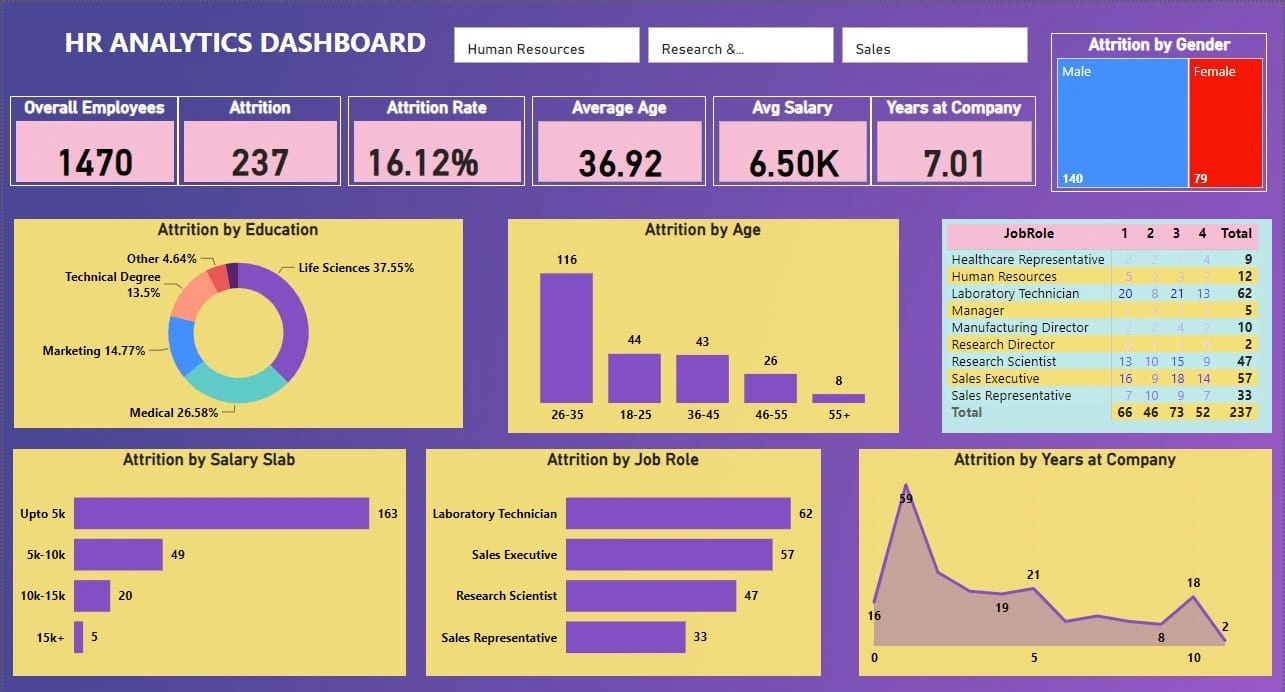
HR Analysis For Attrition
0 likes · 18 views · Dec 20, 2024
Client wants Analysis for Attrition Data to improve key employee retention and making attrition Dashboard Available for Management decisions.

