Inventory Optimization with ABC-XYZ Segmentation
Smita S
Inventory Optimization with ABC-XYZ Segmentation
A Pareto-based analytics solution to unlock capital and improve turnover.
Industry Focus: Manufacturing & Inventory-Heavy Businesses
Tech Stack: MySQL - SQL - Power BI
Problem
A mid-sized manufacturing company struggled with:
Excess capital locked in slow-moving or low-value inventory
Limited visibility into which SKUs mattered most
Reactive replenishment due to unpredictable demand patterns
High number of SKUs with unclear financial contribution
No clear picture of stock health, item-level turnover, or demand risk
Approach
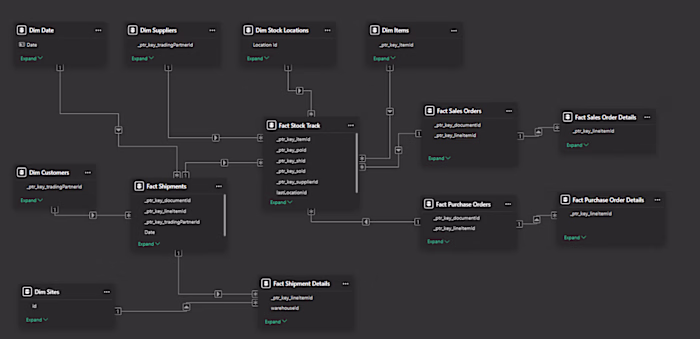
I developed a data-driven inventory intelligence dashboard using ABC-XYZ segmentation in Power BI, layered with stock health status, item-level visibility, and ITR (Inventory Turnover Ratio).
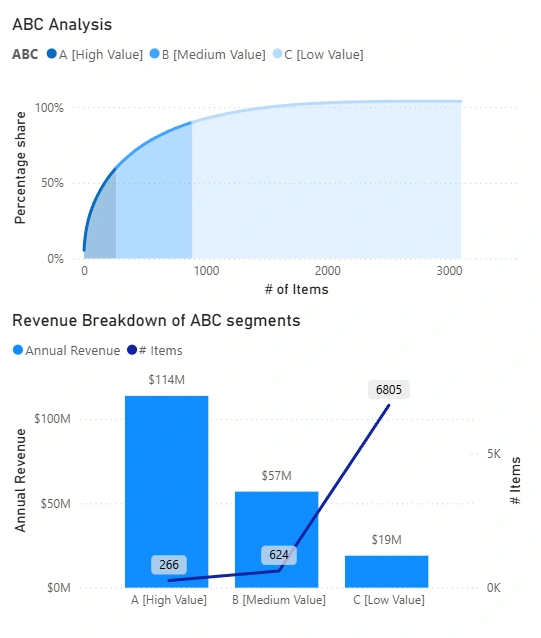
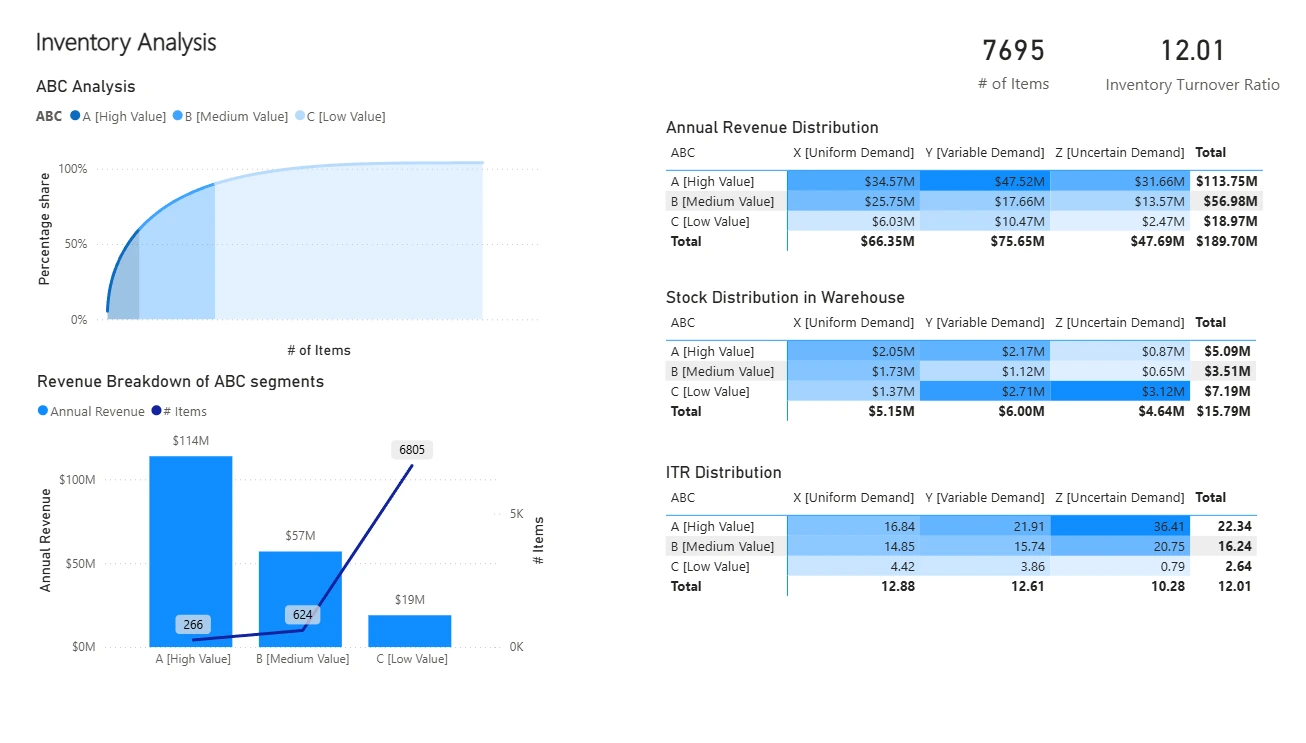
~60% of the revenue was contributed by ~3.5% of the items in segment A
1. ABC-XYZ Segmentation for Inventory Visibility
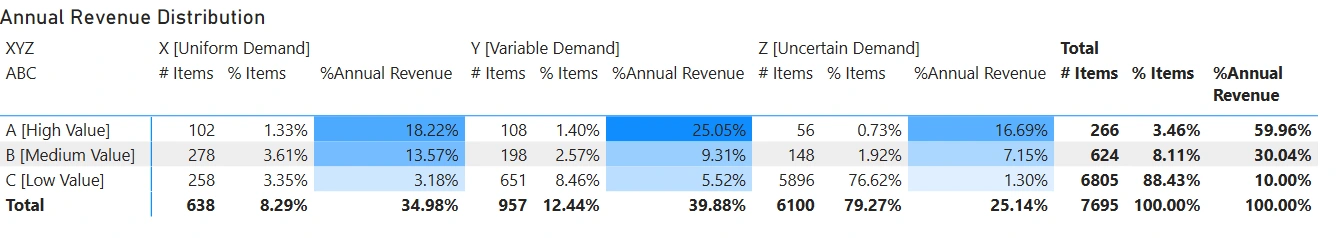
ABC segmentation classified SKUs by their revenue contribution:
90% of revenue came from just 11% of SKUs (Segment A + Segment B)
XYZ segmentation layered demand predictability:
80% SKUs had uncertain demand, yet contributed only ~25% of revenue posing high planning risk.
2. Revenue vs Warehouse Stock
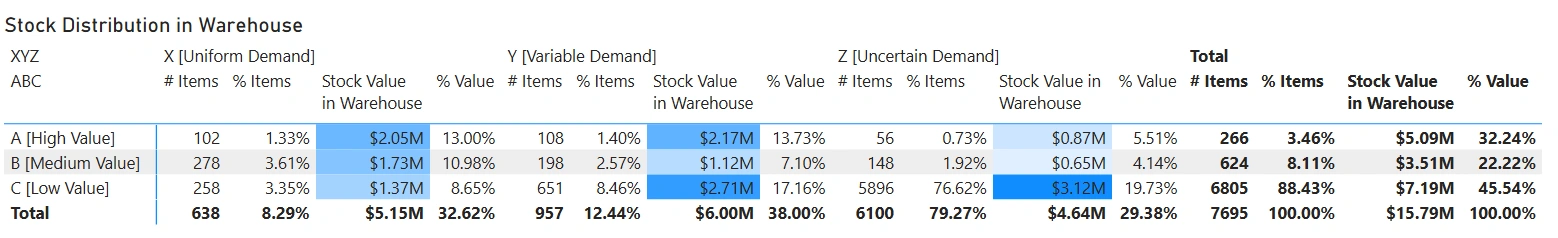
Stock distribution in the warehouse reveals capital misallocation
Key Insights :
46% of warehouse value was tied up in low-value C items, contributing just 10% of revenue.
The worst segment was: CZ items with 76.6% of SKUs drove only 1.3% of revenue, yet held $3.12M (~20%) in stock.
3. ITR Distribution
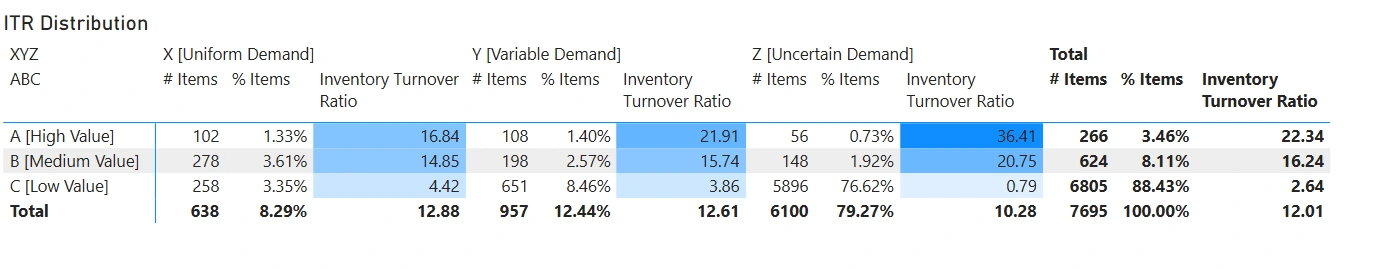
Uncovering inventory movement patterns across ABC - XYZ segments
Inventory Turnover Ratio (ITR) tells us how many times an item is sold and replaced in a year.
Higher ITR = fast-moving stock,
Lower ITR = slow-moving or stuck inventory.
Key Insights :
Segment A items had an excellent ITR of 22.34.These are your best performers, selling quickly.
Segment B items had a healthy ITR of 16.24.
Segment C items had a very low ITR of 2.64. Stock is moving slowly or not at all.
Extremes:
AZ items had the highest ITR of 36.41 - They sell fast but are unpredictable. Requires frequent monitoring and agile restocking.
CZ items had the lowest ITR of 0.79 - They are essentially dead stock. High holding costs and poor returns. These need to be on low priority or cleared out.
4. Stock Health & Item Visibility Dashboards
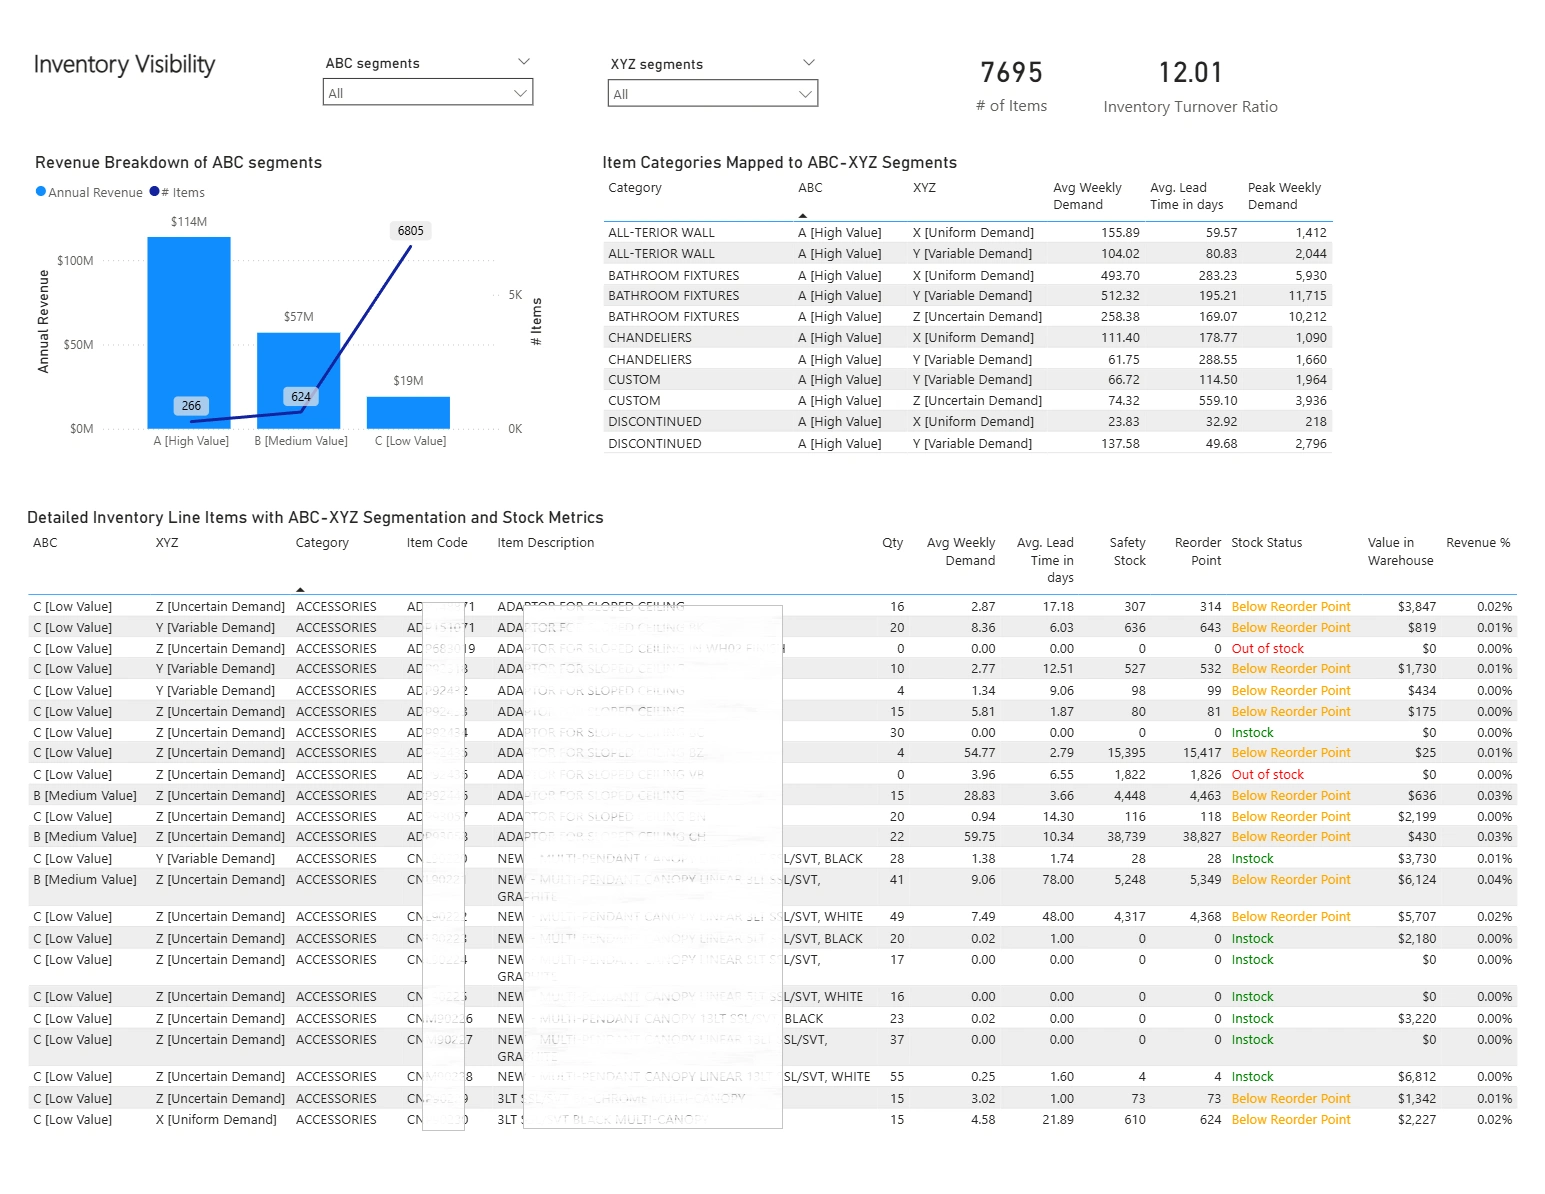
Warehouse managers used the report to monitor stock levels and manage inventory across ABC-XYZ segments effectively.
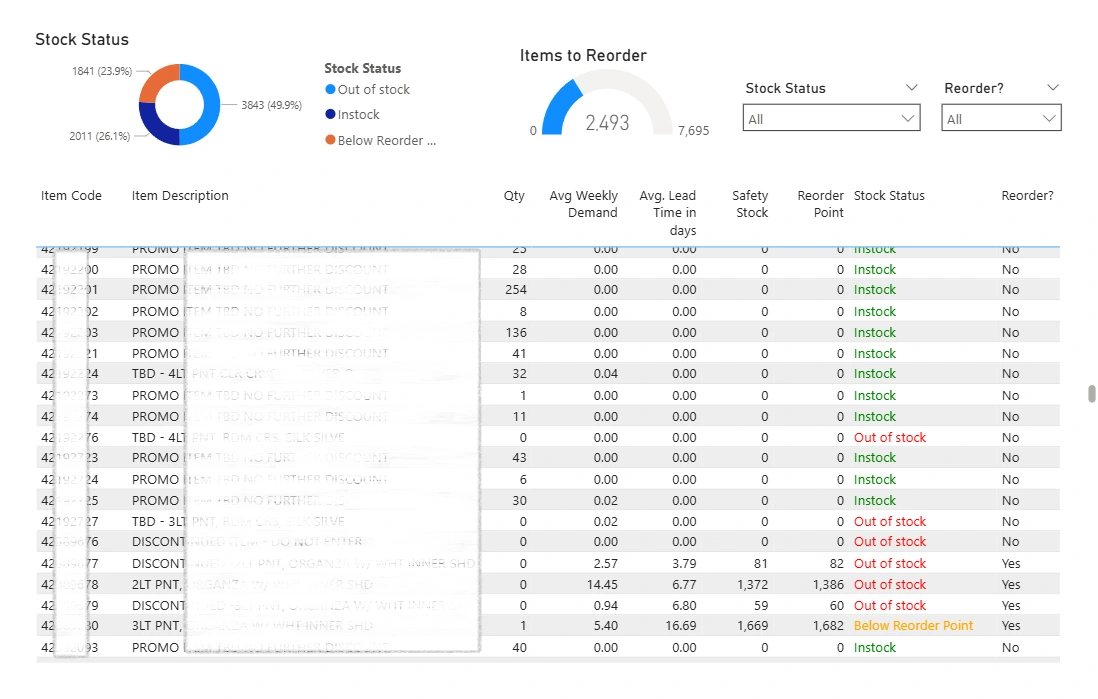
The report identified items that were out of stock or running low, enabling timely replenishment decisions.
Key Insights:
2,493 items (32%) were out of stock or below reorder point
Item-level view enabled:
Tracking safety stock, reorder points, and stock status
Cross-filtering by ABC-XYZ classification
Real-time monitoring of stockouts in high-value segments
High-value items (A-class) were found out of stock, while thousands of low-value CZ items were fully stocked with zero demand.
Outcome | Business Impact
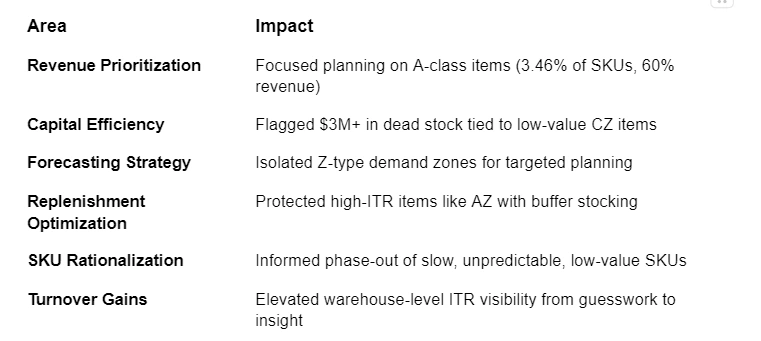
Key actionable insights
Conclusion
This project transformed scattered inventory data into actionable insights using ABC-XYZ segmentation, item visibility, and turnover analysis.
By highlighting high-impact SKUs, exposing dead stock, and aligning stock levels with demand patterns, the business unlocked tied-up capital, improved planning, and increased inventory efficiency.
It’s a clear example of how well-applied analytics can drive real operational and financial impact beyond reporting.
Table of Contents
Like this project
Posted Aug 6, 2025
Built inventory dashboard using ABC-XYZ segmentation for a manufacturing firm; improved ITR, flagged dead stock, and enabled smart replenishment in Power BI