Power BI Templates for Self-Service Reporting
Smita S
Power BI Templates for Self-Service Reporting in Sales, Inventory & Fulfillment Operations
Developed a reusable Power BI template on top of the SaaS platform's MySQL schema to enable self-service reporting for sales, inventory, and fulfillment operations.
Client Context
As a consulting partner for a fast-growing SaaS company offering sales order and inventory management software, I was tasked with solving a key challenge: enabling self-service reporting for their clients mainly 3PLs, manufacturers, and inventory-heavy businesses.
Each customer had a dedicated MySQL database instance supporting sales, fulfillment, and accounting operations. However, custom reporting remained a recurring pain point.
Problem
Clients wanted to track performance across sales, inventory, and fulfillment but struggled with:
Understanding the complex database schema.
Figuring out where to find relevant fields (e.g., invoice amounts, return reasons, refund status).
Building the same reports from scratch for each instance.
Repeatedly relying on the vendor’s technical team for report development.
The result: delays in operational reporting, lack of visibility, and reduced efficiency in decision-making.
Solution
I developed a reusable Power BI template that could be deployed across all customer instances, with a pre-modeled semantic layer built on top of the SaaS platform's MySQL schema.
Pre-modeled semantic layer
The Power BI model included:
Dimension Tables
Dim CustomersDim DateDim ItemsDim OwnersDim RMA Return ReasonDim RMA TypesDim SitesFact Tables
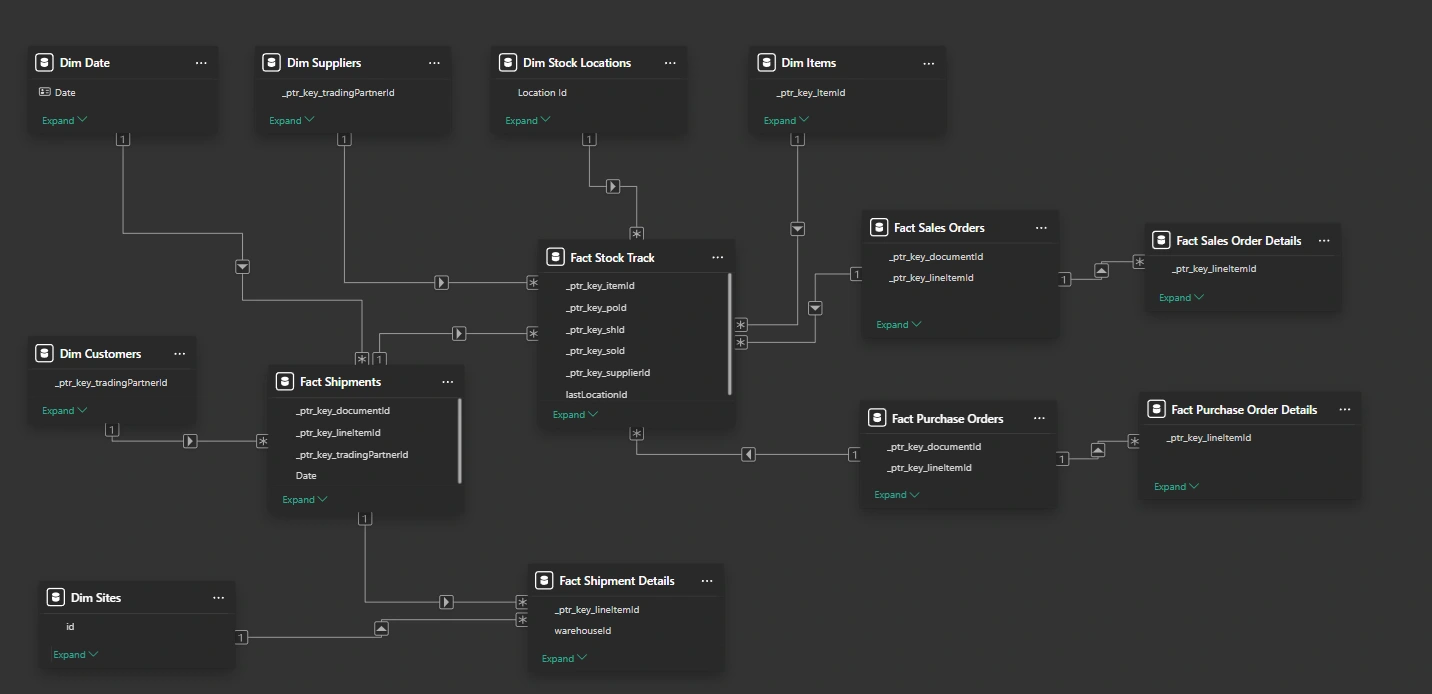
Fact Sales Order, Fact Sales Order DetailsFact Cash Sales, Fact Cash Sales DetailsFact Customer Credit Notes, Fact Customer Credit Note DetailsFact Customer Payments, Fact Customer Payment DetailsFact Customer Refunds, Fact Customer Refund DetailsFact RMAs, Fact RMA DetailsFact Sales Invoices, Fact Sales Invoice DetailsFact Shipments, Fact Shipment DetailsFact Purchase Orders, Fact Purchase Order DetailsFact Purchase Invoices, Fact Purchase Invoice DetailsFact Stock Track Each of these was fully mapped, with relationships modeled around customer ID, item ID, and date keys enabling seamless navigation across modules.
Field Mapping Strategy
To reduce the learning curve for clients, all database fields were mapped and renamed in the data model to exactly match the names used in the SaaS platform’s frontend forms such as Sales Orders, Purchase Invoices, Line Items, etc.
This ensured that end users could quickly locate relevant fields in Power BI without needing to understand database-level naming conventions or schema complexity. For example:
Fields like
sales_order_number, invoice_date, and line_item_quantity were renamed to their exact frontend labels (e.g., "Sales Order #", "Invoice Date", "Qty")All metrics and slicers used business-friendly names that mirrored the SaaS UI
This design decision significantly improved field discoverability and reduced support requests during report development.
Data Modeling Approach
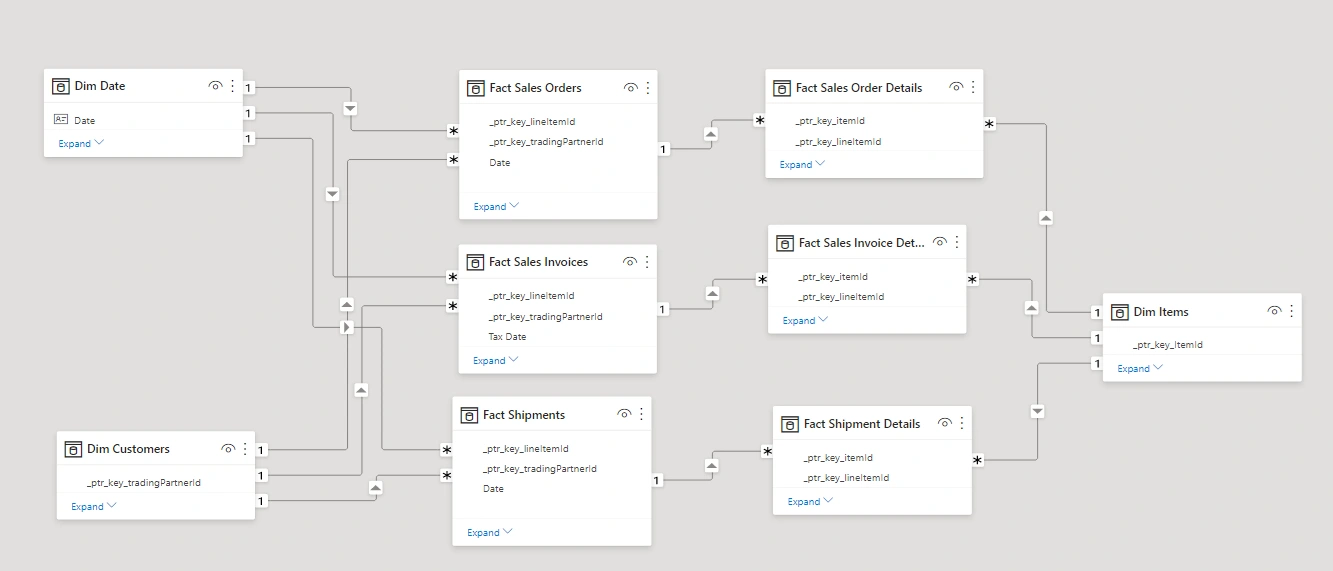
The Power BI data model was designed using a hybrid approach:
Star schemas were used where possible to maintain simplicity and performance (e.g.,
Fact Sales Orders with its related dimensions).A constellation schema was used to support shared reporting across sales, inventory, procurement, and fulfillment, enabling efficient filtering and analysis across modules without duplicating dimensions like
Items, Customers, and Dates.This approach ensured:
High performance for business users.
Flexibility to build cross-functional reports (e.g., stock vs. sales vs. shipments).
Consistent dimensions for comparison across different fact sources.
Pre-Built Metrics & KPIs Included
Total Sales, Cash Sales, Credit Notes Issued
Payment Collected vs. Outstanding
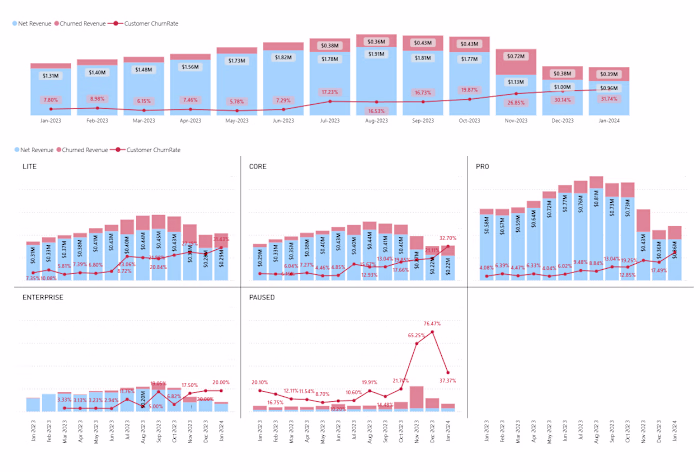
Refund Volume and Rate
Return Reasons & Types Distribution
On-Time vs Delayed Fulfillment
Item-Level Sales Performance
Key Report Pages Delivered
Sales Performance Overview
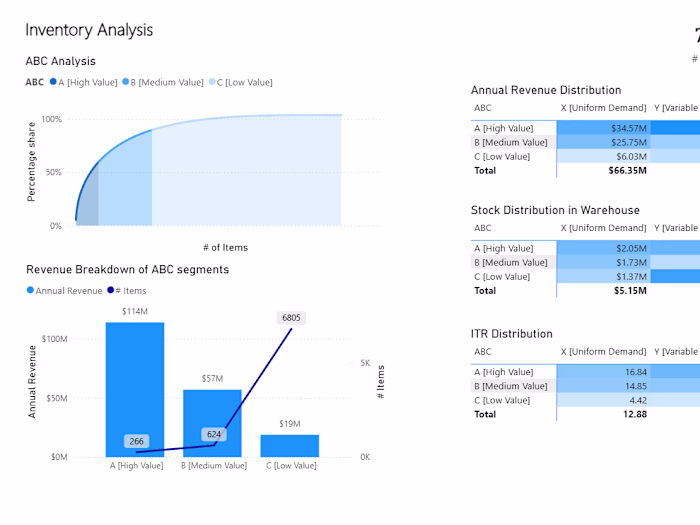
Inventory Movement & Stock Analysis
RMA (Returns) Trends & Root Causes
Payments & Refund Reconciliation
Fulfillment SLA Dashboard
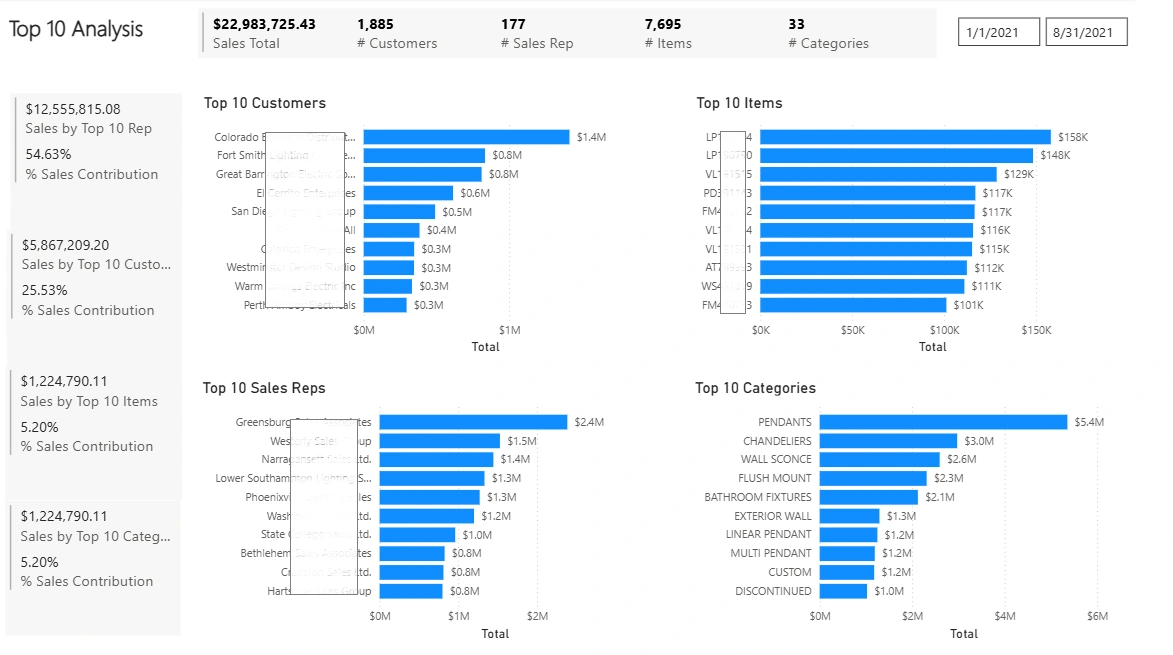
Top Sales Contributors by Customer, Sales Rep, Item, and Category
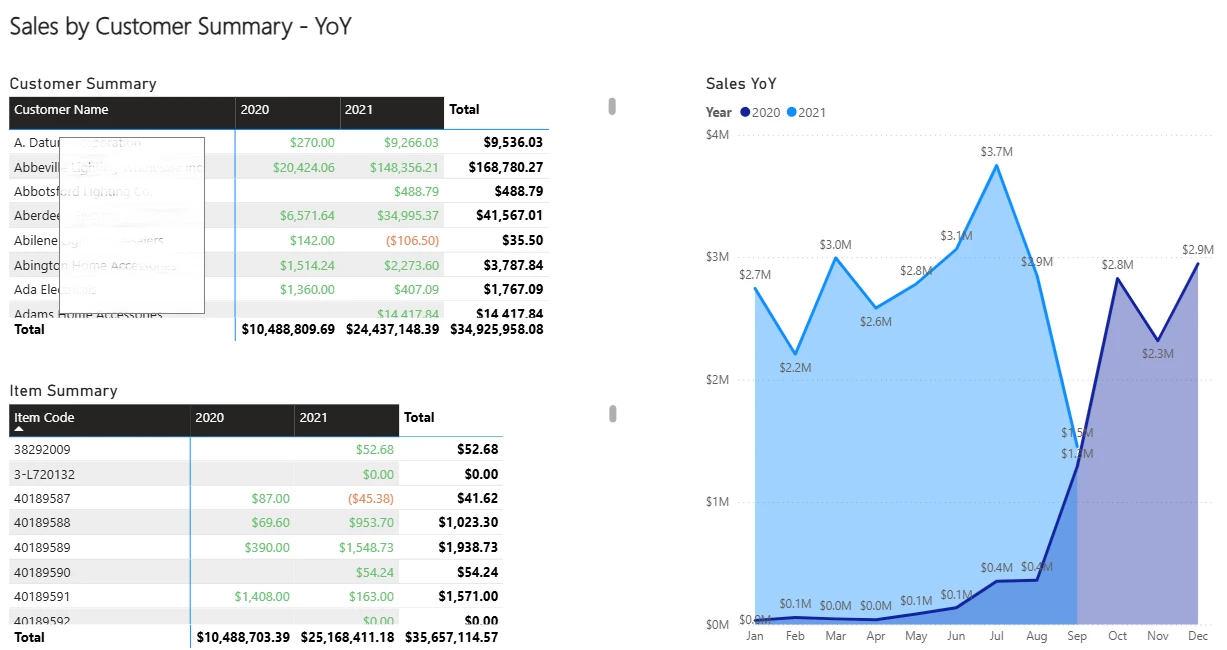
Year-over-Year Sales Analysis with Customer and Item-Level Breakdowns
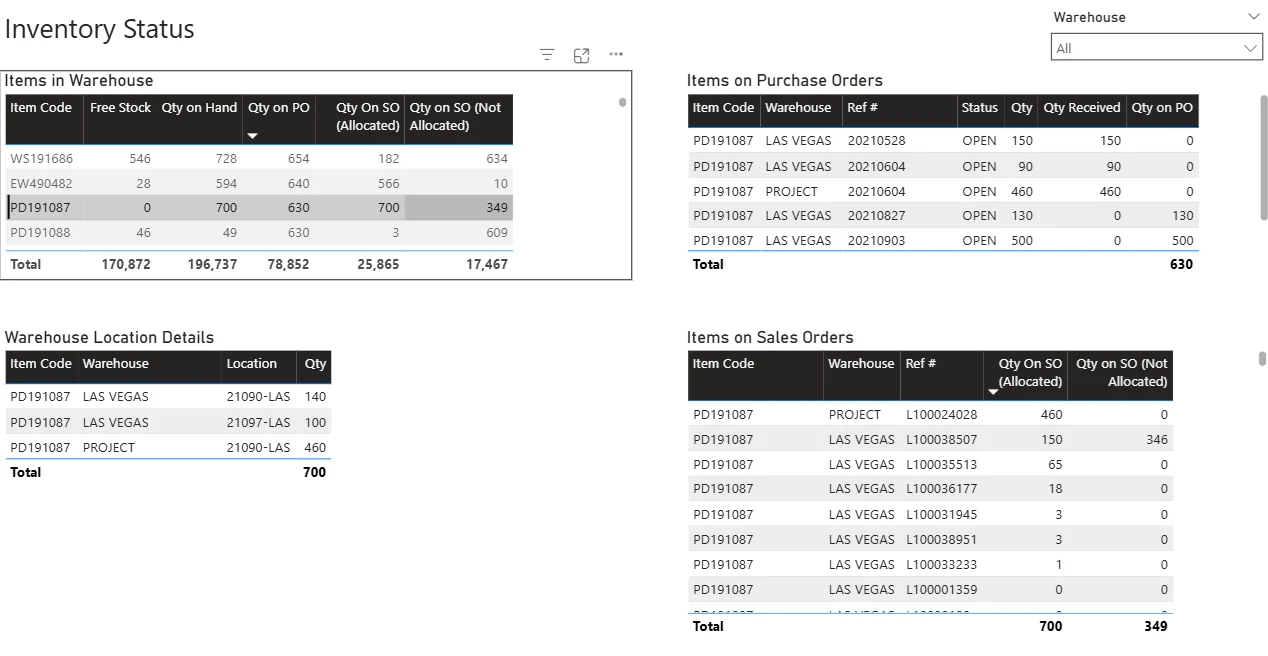
Comprehensive Inventory Snapshot: Warehouse Stock, Open POs, and Unallocated Sales Orders by Item and Location
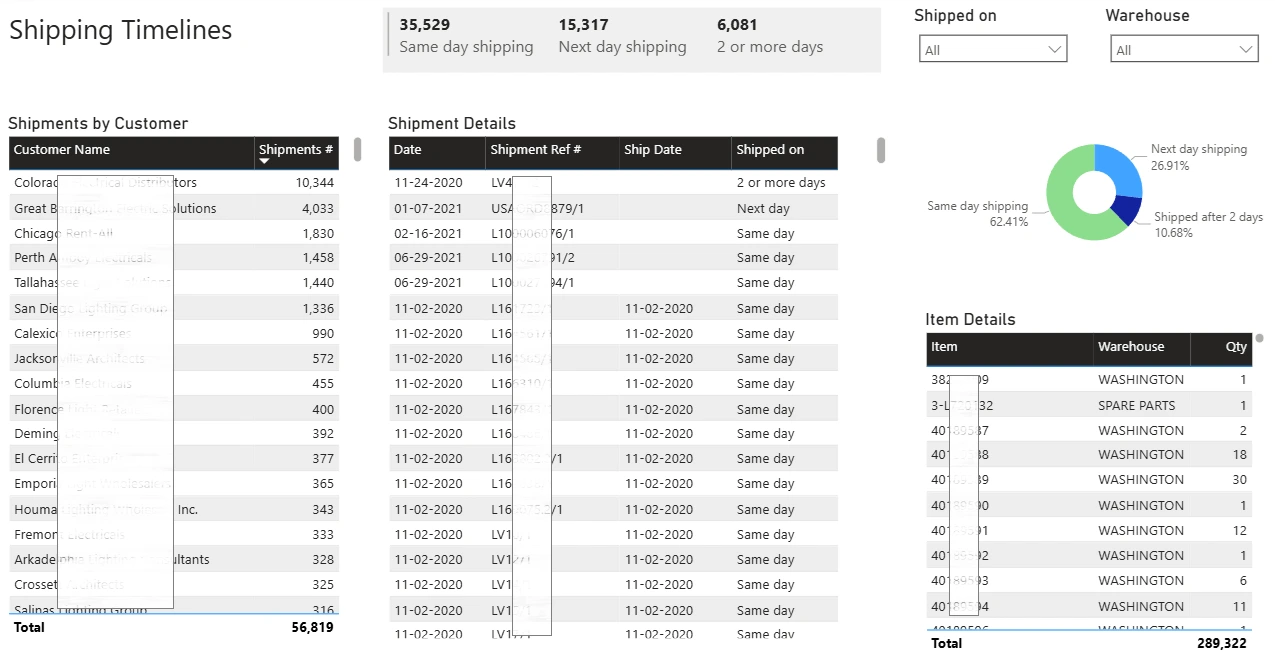
Shipping Performance Dashboard: Track Same-Day, Next-Day, and Delayed Shipments by Customer and Item
With the template, customers could simply connect to their MySQL instance, refresh data, and begin building or customizing reports without worrying about SQL joins or field discovery.
Tech Stack
Database: MySQL (one per customer instance)
BI Tool: Power BI Desktop (.PBIT template)
Modeling: Star schema and constellation schema with DAX measures and Power Query transformations
Deployment: Shared with onboarding documentation for plug-and-play use
Outcome
Enabled self-service analytics for operational teams with no SQL expertise.
Cut report development time by 80% for new customers.
Internal support team saw a 50% drop in ad-hoc reporting requests.
Delivered rich visibility across sales, inventory, payments, and returns.
The template became part of the standard onboarding kit, accelerating adoption and offering a new layer of value-added service.
Table of Contents
Like this project
Posted Aug 6, 2025
Developed a Power BI template for self-service reporting in sales, inventory, and fulfillment operations.