The network for creativity
Join 1.25M professional creatives like you
Connect with clients, get discovered, and run your business 100% commission-free
Creatives on Contra have earned over $150M and we are just getting started
Back to feedPost

Marketplace Profitability & P&L Engine
Overview
This project is an end-to-end E-commerce Marketplace Analytics solution built using MySQL, SQL, Power BI, and Excel.
The objective of this project is to analyze marketplace profitability across multiple sales channels by calculating revenue, product costs, marketplace commissions, shipping expenses, and net profit.
The project simulates a real-world marketplace operations environment where business teams need visibility into product performance, marketplace profitability, and operational KPIs.
Business Problem
E-commerce businesses often track revenue but fail to understand true profitability.
This project helps answer key business questions:
Which marketplace generates the highest profit?
Which products are most profitable?
How do commissions impact margins?
What is the overall profit margin?
How does shipping cost affect profitability?
Tech Stack
MySQL
SQL
Power BI
Microsoft Excel
Data Sources
Products
Contains SKU-level product information.
Fields:
SKU
Product Name
Category
Cost Price
Selling Price
Orders
Contains marketplace order transactions.
Fields:
Order ID
Order Date
Marketplace
SKU
Quantity
Marketplace Charges
Marketplace commission structure.
Fields:
Marketplace
Commission Percentage
Shipping Cost
Shipping cost by marketplace.
Fields:
Marketplace
Shipping Cost
Returns
Order return information.
Fields:
Order ID
Return Status
SQL Implementation
The project uses multiple SQL tables and joins to create a unified profitability dataset.
Key SQL Concepts Used:
CREATE TABLE
INNER JOIN
SQL Views
Aggregations
Calculated Metrics
A consolidated analytical view was created:
vw_marketplace_pnl
This view combines all business logic and serves as the primary source for Power BI reporting.
Profitability Metrics
Revenue
Revenue = Quantity × Selling Price
Product Cost
Product Cost = Quantity × Cost Price
Commission Cost
Commission Cost = Revenue × Marketplace Commission %
Shipping Cost
Shipping Cost = Quantity × Shipping Cost
Profit
Profit = Revenue − Product Cost − Commission Cost − Shipping Cost
Profit Margin %
Profit Margin % = Profit / Revenue
Power BI Dashboard
Executive Summary
KPIs:
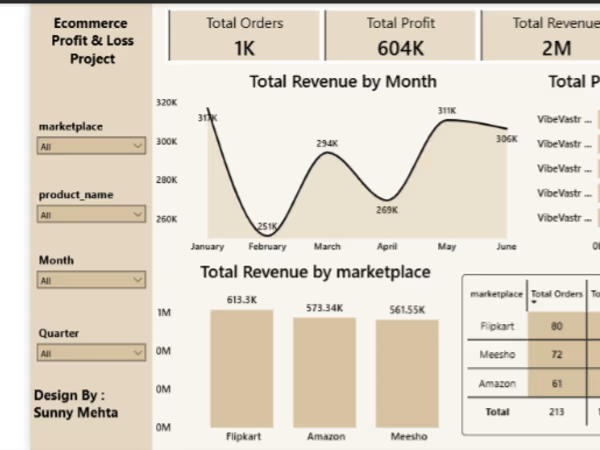
Total Revenue
Total Profit
Total Orders
Profit Margin %
Marketplace Analysis
Revenue by Marketplace
Profit by Marketplace
Marketplace Performance Comparison
Product Analysis
Top Profitable Products
Product Revenue Analysis
Product Profitability Ranking
Trend Analysis
Revenue Trend
Profit Trend
Order Trend
Project Architecture
Excel → MySQL → SQL View → Power BI Dashboard
Key Outcomes
Built a scalable marketplace profitability model.
Centralized business logic using SQL Views.
Automated profitability calculations.
Delivered interactive executive dashboards for decision-making.
Simulated a real-world marketplace operations analytics workflow.
Skills Demonstrated
SQL
Data Modeling
Business Intelligence
Power BI
E-commerce Analytics
Marketplace Operations
Profitability Analysis
Data Visualization
Author
Sunny Mehta
Open to opportunities in:
E-commerce Operations
Marketplace Management
Business Analytics
Operations Analytics
Data Analytics


The network for creativity
Join 1.25M professional creatives like you
Connect with clients, get discovered, and run your business 100% commission-free
Creatives on Contra have earned over $150M and we are just getting started




Related posts

📊 Interactive Sales Analytics Dashboard in Excel
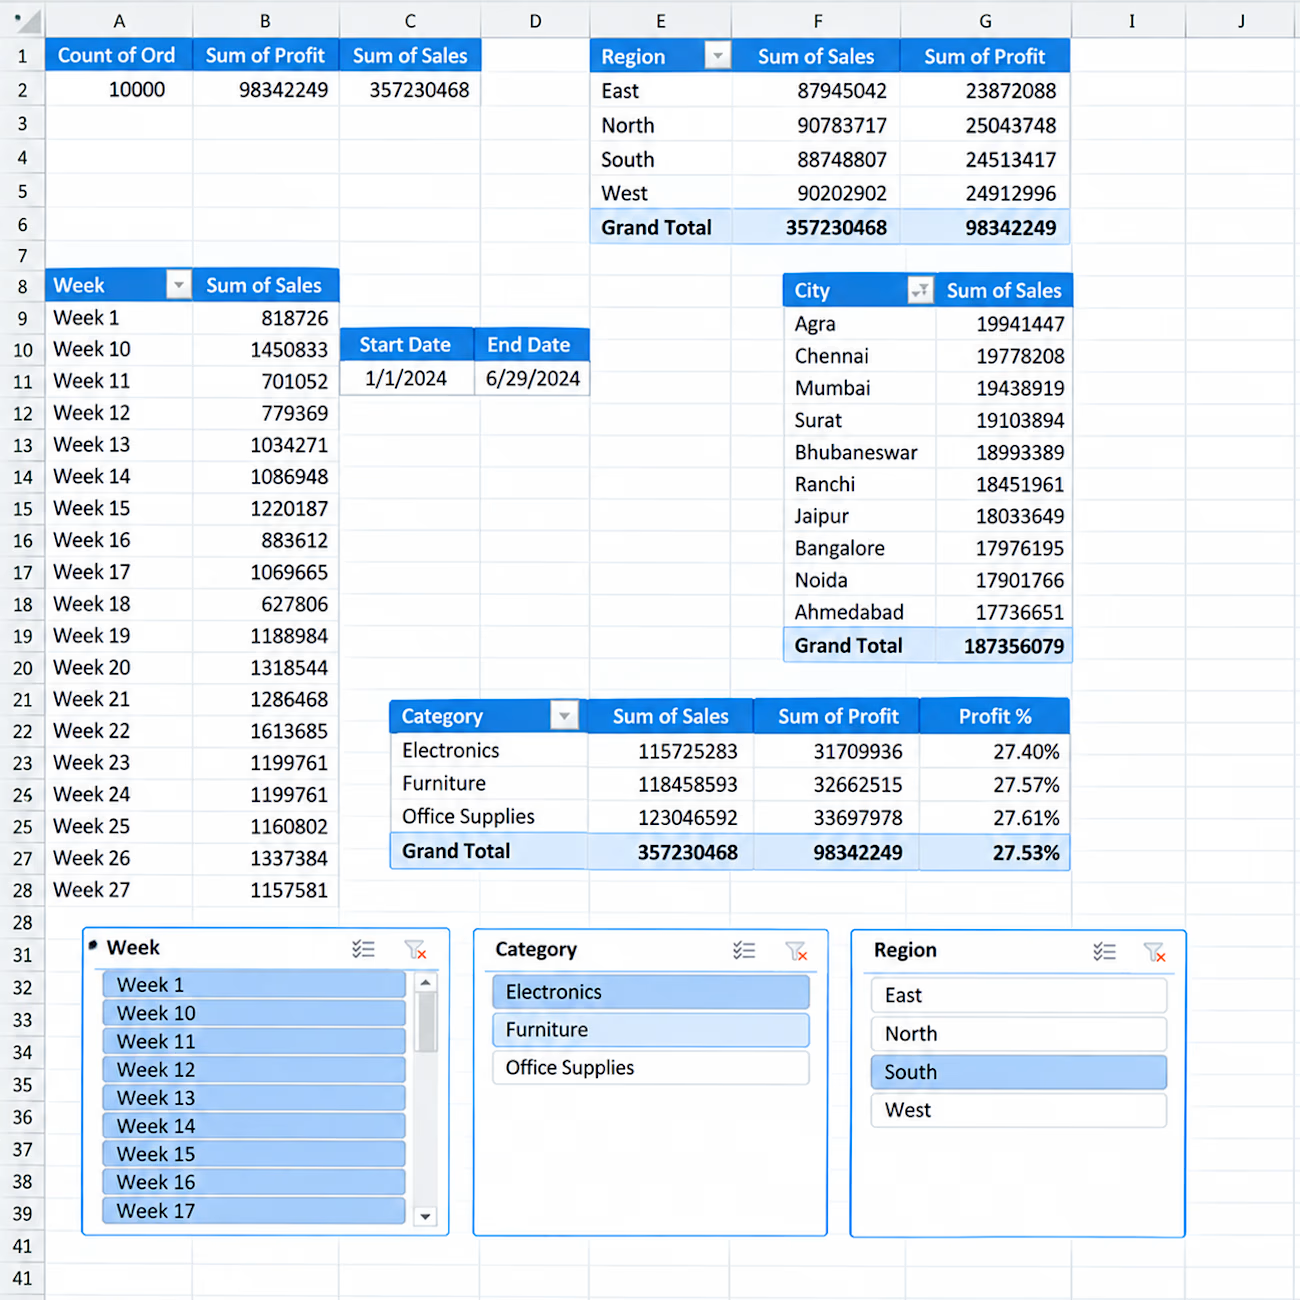
I created an interactive Excel dashboard to analyze sales performance across different business dimensions.
Key Insights & Features:
• Total Orders, Sales & Profit KPIs
• Sales & Profit by Region
• Sales by City
• Category-wise Sales, Profit & Profit %
• Weekly Sales Analysis
• Interactive Slicers for Week, Category & Region
• Start Date & End Date tracking
• PivotTable-based analysis
This dashboard is designed to turn raw sales data into clear and actionable business insights using Excel.


Hello.
I guess we're in the same page about data analysis and visualization
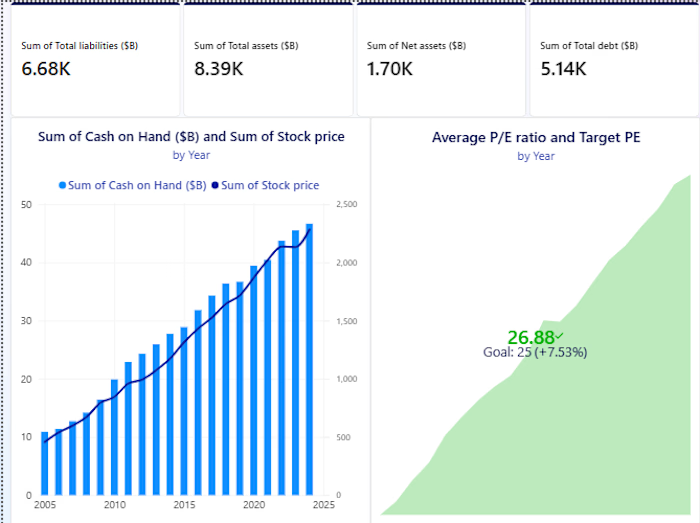

Starter Tier Project
Project name (100 characters limit)
Starter E-Commerce Sales & Inventory Dashboard
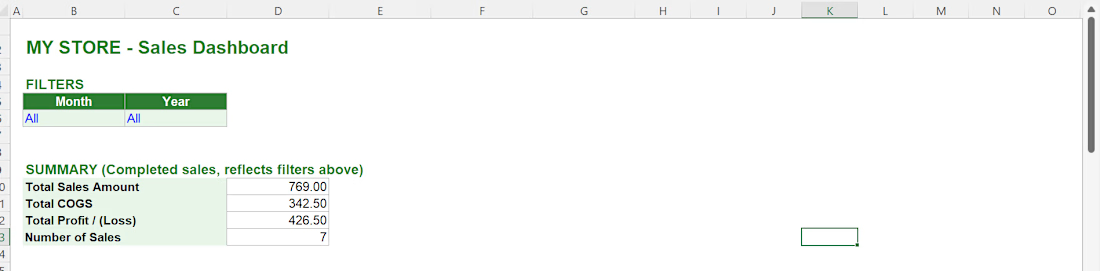
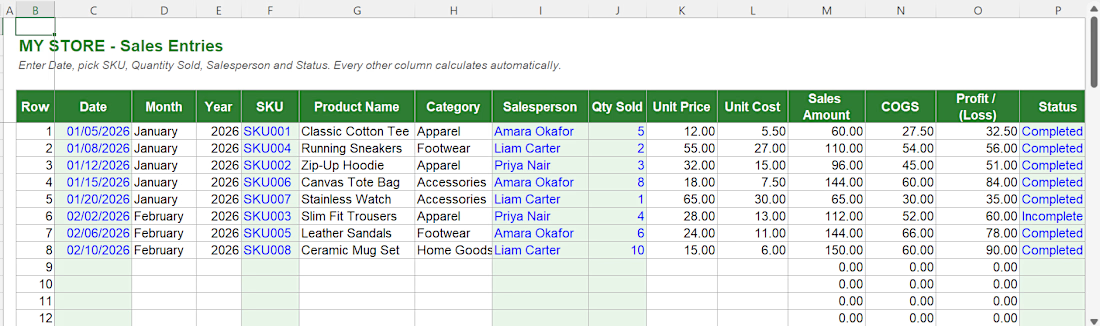
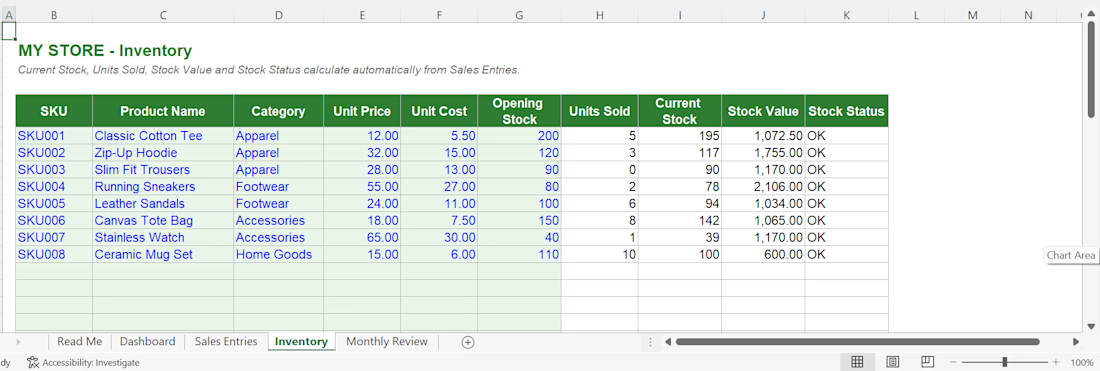
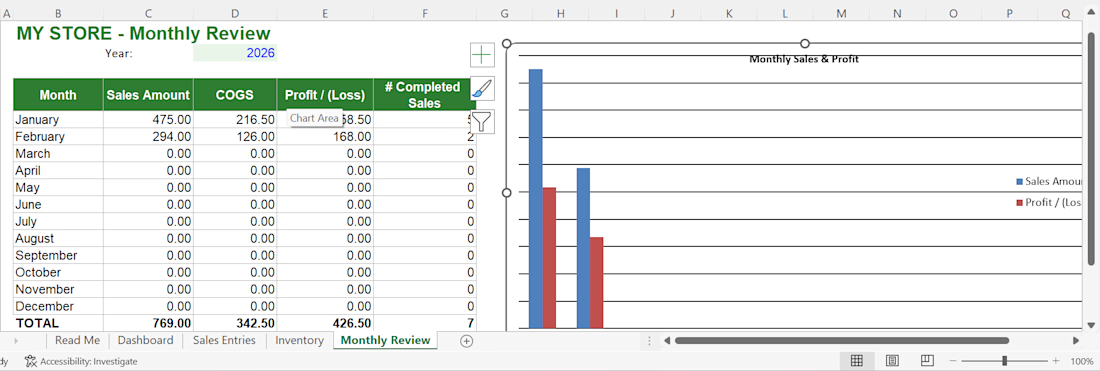

this my latest created dashboard and any work with me i will freely by your business analysis and business growth it help full for my project building