Flipkart Sales Analysis Dashboard
Ateeb Mahedvi
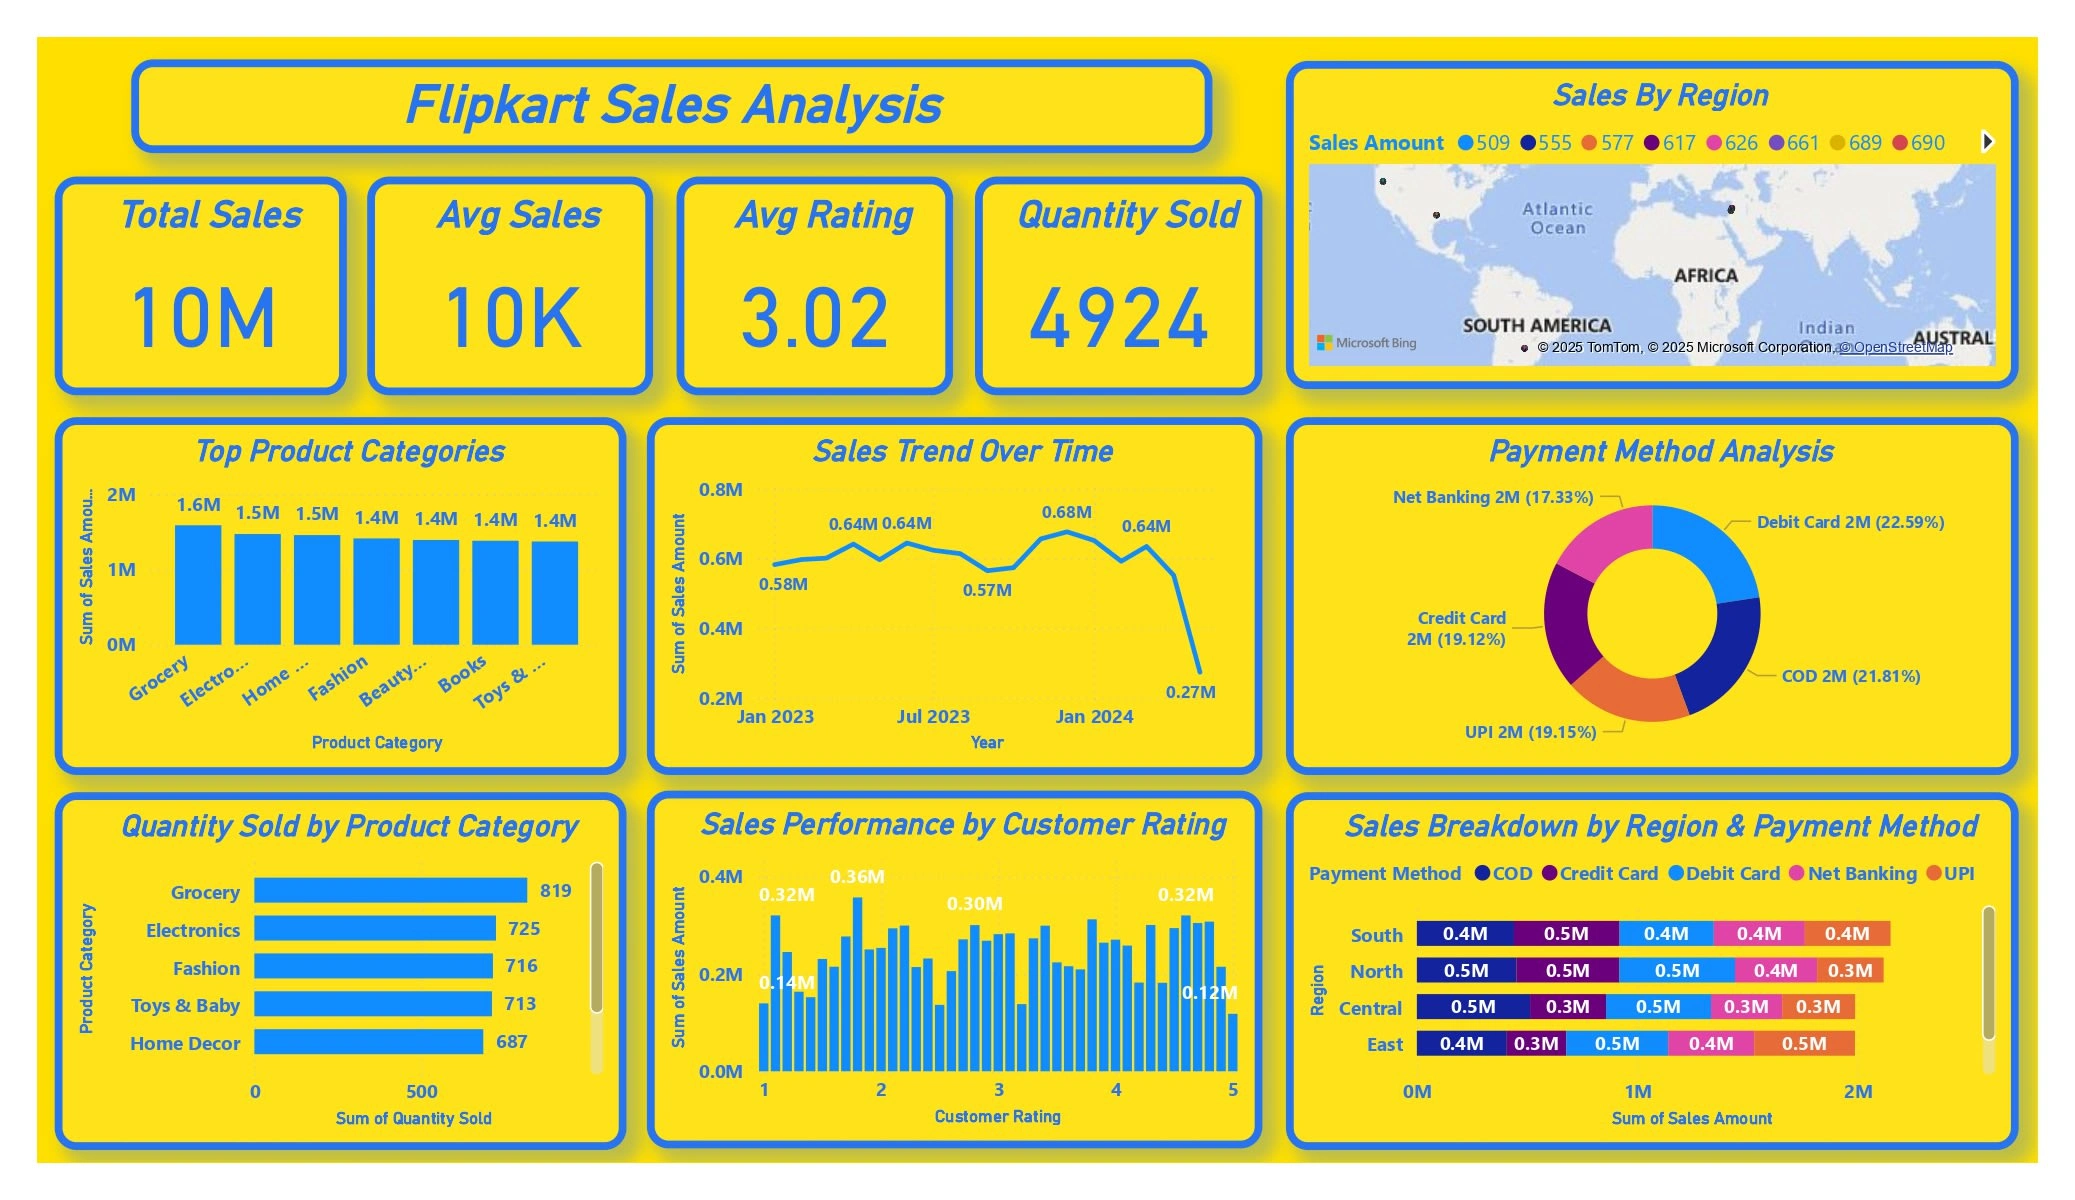
🚀 Flipkart Sales Analysis | Power BI Project 📊 I’m excited to share my latest project—an end-to-end Sales Analysis Dashboard for Flipkart using Power BI! 🔍 Key Insights: • 📈 Total Sales: ₹10 million • 💳 Most used payment method: Debit Card (22.6%) • 🏆 Top Category: Grocery (₹1.6M in sales, 819 units sold) • 📍 Best performing regions: South and North • 🌟 Sales peak: January 2024 with ₹0.68M • ⭐ Average Customer Rating: 3.02 (with best performance at rating 3) 💡 Recommendations: • Focus on high-rated product promotions • Improve reach in Central and East regions • Run campaigns during high-sale months like January • Prioritize inventory for Grocery and Electronics 📌 Tools Used: Power BI | DAX | Data Modeling | Data Visualization 👉 Swipe through the PDF to see the dashboard and insights in action! #PowerBI #DataAnalysis #DataVisualization #BusinessIntelligence #Flipkart #Analytics #Dashboard #DataAnalyst #SQL #Python #AteebRahilMahedvi
Like this project
Posted Jul 19, 2025
Built a Power BI dashboard to analyze sales trends, top categories, and regional performance, turning raw data into actionable insights.