Excel Sales Dashboard Project
Ateeb Mahedvi
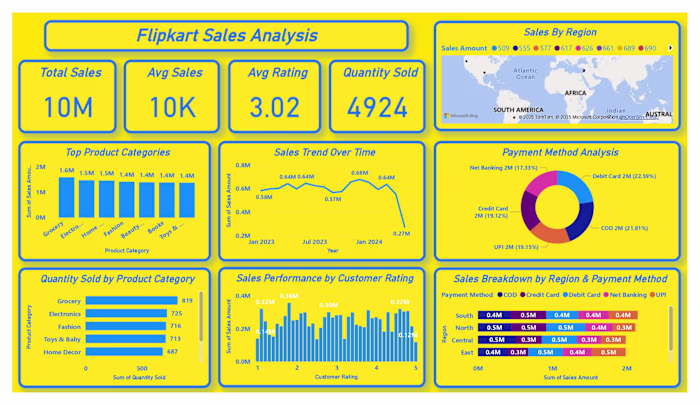
📊 Excel Sales Dashboard Project 💻 Excited to share a Sales Dashboard I created using Microsoft Excel to analyze multi-platform e-commerce sales performance. 🔍 Key Insights: 🏆 Top Performing State: Maharashtra leads in sales volume. 🛒 Platform Share: Flipkart has the highest share (21.4%), followed closely by Ajio and Amazon. 👥 Gender Distribution: Orders are almost equally placed by female (50.6%) and male (49.4%) customers. 👨👩👧👦 Age Group Engagement: 40–59 age groups are the most active. 📦 Order Status: Delivered, cancelled, and returned orders are evenly split—each around 33%. 📅 Monthly Trends: March saw the highest order volume; a noticeable decline follows in mid-year months (June–Aug). ✅ Recommendations: 🔄 Improve Fulfillment: Focus on reducing returns and cancellations by analyzing common issues (e.g., logistics, product quality). 🎯 Targeted Marketing: Create tailored campaigns for the 40–59 age group, as they show the highest engagement. 🛍️ Platform Partnerships: Optimize performance on platforms like Amazon and Myntra to close the gap with Flipkart. 📈 Boost Low Sales Months: Launch seasonal discounts or awareness campaigns between June–August to revive sales. 🧠 Leverage Gender Parity: Since gender-based orders are balanced, keep messaging inclusive and personalized. 🛠️ Tools Used: Microsoft Excel – Pivot Tables, Charts, Slicers, Custom Formatting 🔗 View the Excel Dashboard: https://lnkd.in/gTcYDRcx This project is part of my learning path in data analytics and dashboard design. Happy to hear your thoughts or suggestions! #ExcelDashboard #DataAnalytics #SalesInsights #DashboardDesign #ExcelProjects #BusinessIntelligence #AteebRahilMahedvi #LearningByDoing #PowerOfExcel
Like this project
Posted Jul 19, 2025
Transformed raw sales data into an easy-to-use dashboard for business insights.
Likes
0
Views
2