Data Visualisation and Storytelling using Power BI
Rohit Poddar
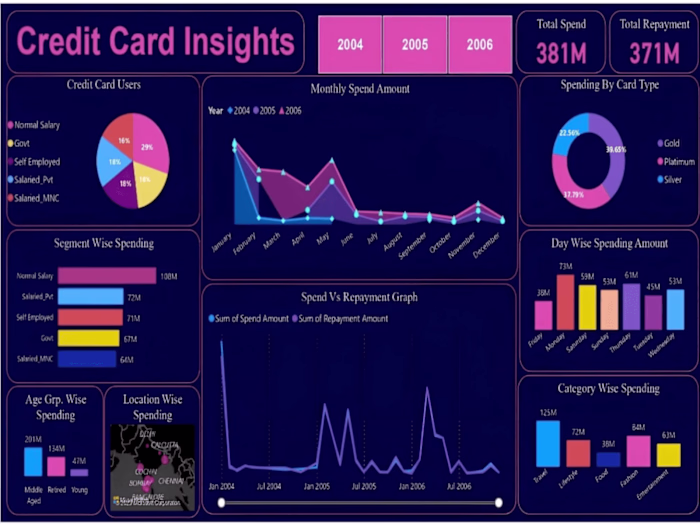
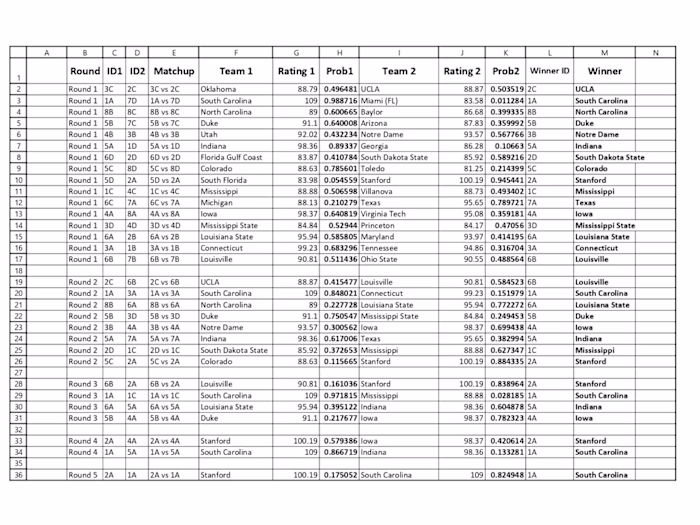
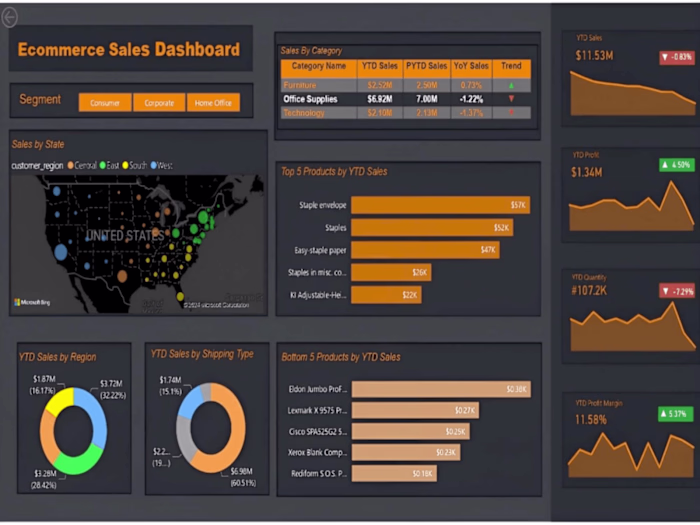
In response to an urgent request from a valued US-based client, I successfully executed a comprehensive Data Visualization and Storytelling project using Power BI, delivering impactful results within an impressive 10-hour timeframe. Leveraging my expertise in discerning key insights from data, I crafted compelling visualizations that not only showcase the data but also tell a meaningful story. The project required quick thinking, efficiency, and a deep understanding of the client's goals. In the final deliverable, you will find a well-organized presentation of visualizations, accompanied by a concise paragraph elucidating the significance of each visualization and providing valuable insights derived from the data. The project documentation is conveniently compiled in a single file for your ease of access and review.
Like this project
Posted Feb 25, 2024
Completed urgent 10-hour Power BI project for US client—crafted impactful visualizations with concise, data-driven storytelling.
Likes
0
Views
97