
Sarbjot Singh
Power BI Expert | Turning Raw Data into Actionable Insights
New to Contra
Sarbjot is ready for their next project!

Data Analytics Project | BlinkIT Grocery Sales Analysis
Excited to share my latest Data Analytics project ,where I analyzed BlinkIT Grocery Sales Data and delivery data to uncover meaningful business insights 📈
📊 What I worked on:
Analyzed sales performance across product categories, outlet types, sizes, and locations
Identified top-performing item categories and customer preferences
Studied the impact of outlet size, establishment year, and visibility on sales
Converted raw data into actionable insights and business recommendations
💡 Key Insights:
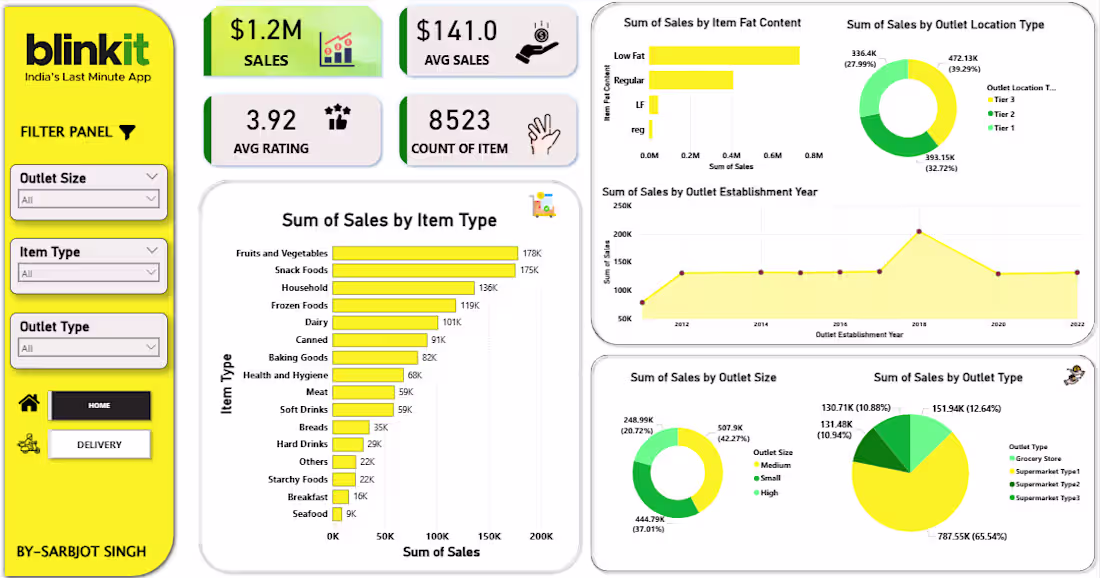
Fruits & Vegetables, Snack Foods, and Frozen Foods drive maximum sales
FOR FULL PROJECT VIST GIT HUB –( https://lnkd.in/d34sdAPz
)
1
60
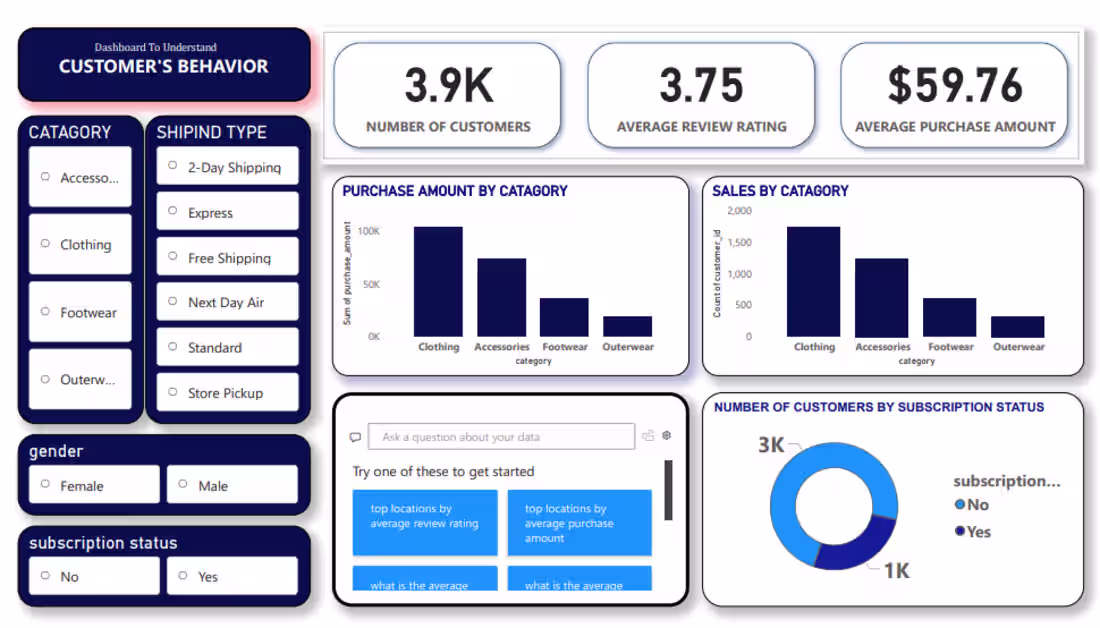
I’m excited to share my latest Data Analytics project where I analyzed Customer Shopping Behavior to uncover trends in sales, demographics, and purchasing habits.This project was a great exercise in building a complete data pipeline.
The Tech Stack:
Python (Pandas & NumPy): Used in Jupyter Notebooks for initial data exploration and statistical analysis.
PostgreSQL: Utilized for rigorous data cleaning, querying, and structuring the dataset for analysis.
Power BI: Built an interactive dashboard to visualize key metrics like seasonal trends, subscription impacts, and category performance.
Project Highlights:
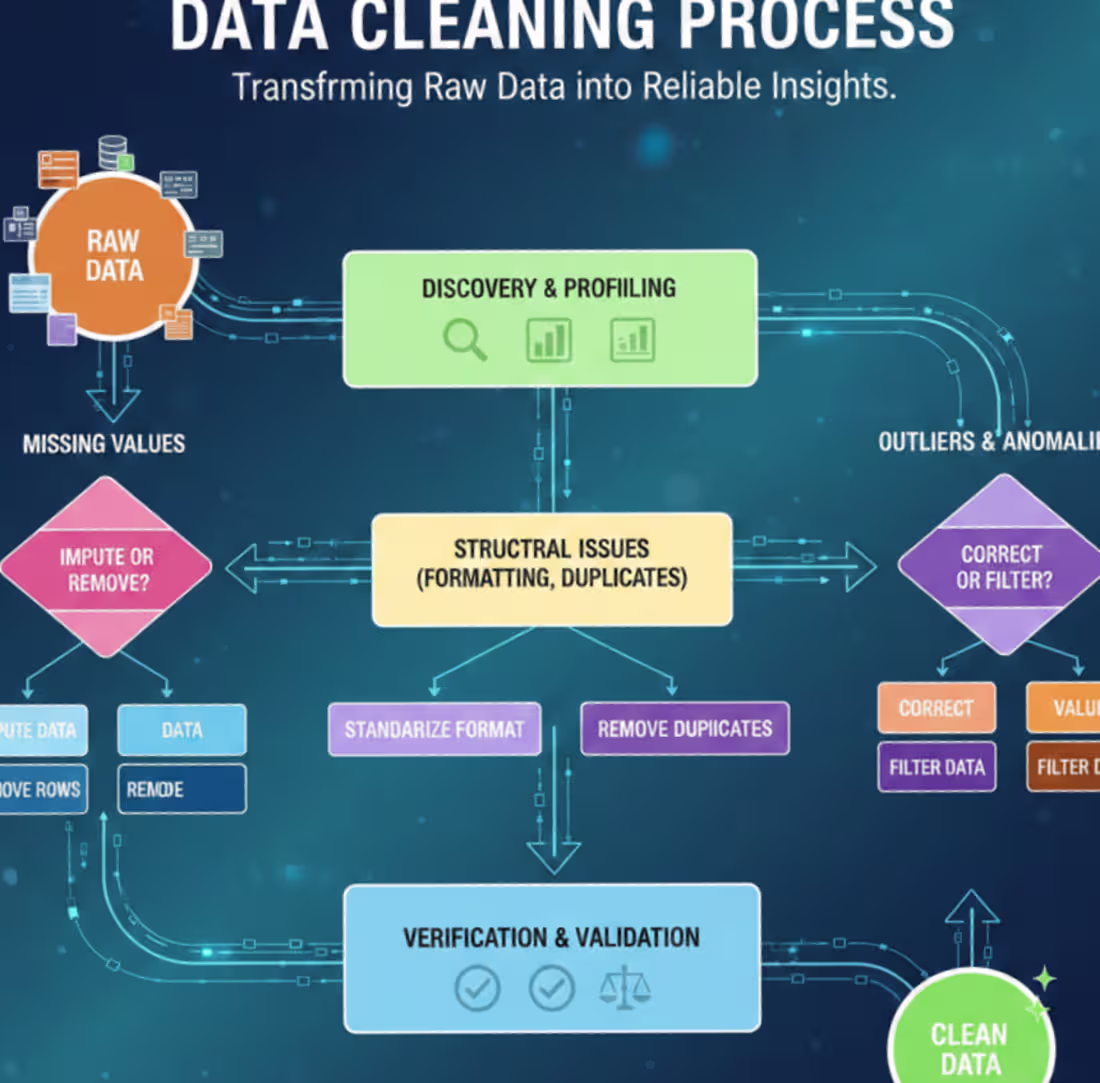
✅ Data Cleaning: Leveraged PostgreSQL and Pandas to handle missing values and standardize categorical data.
1
2
88
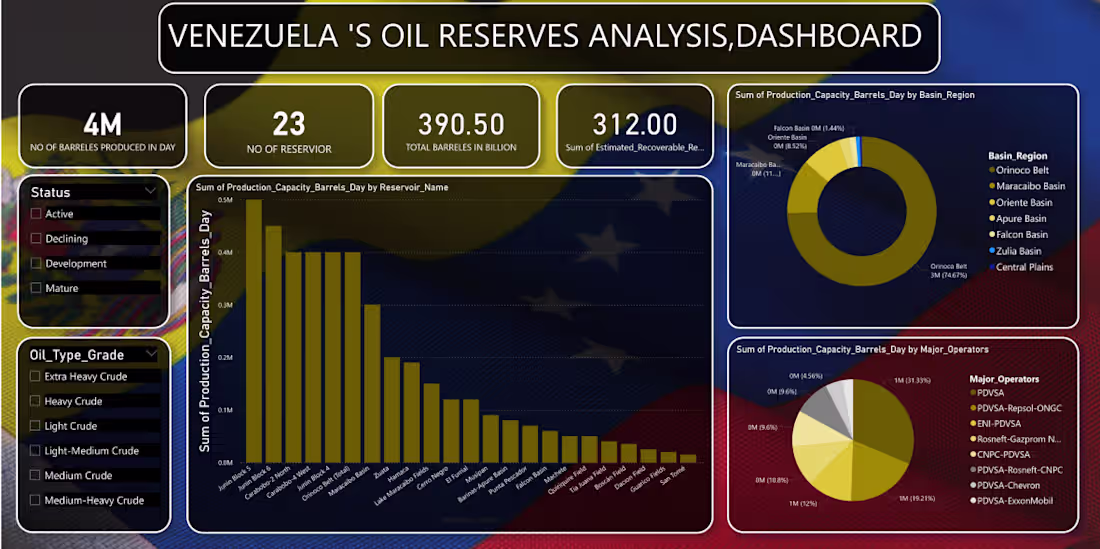
Venezuela’s Oil Reserves Analysis Dashboard 📊
I am excited to share my latest data analytics project focusing on the energy sector. Using a dataset covering 23 reservoirs, I designed a comprehensive dashboard to track production capacity and resource distribution in Venezuela.
Key Features: ✅ Real-time Metrics: Tracking the 390.50 Billion total barrels in reserve. ✅ Granular Analysis: Production capacity breakdown by reservoir name and oil grade (Extra Heavy to Light). ✅ Stakeholder Mapping: Visualizing the production sum by major operators.
Tools Used: [pandas(jupyter notebook)/mysql(for analysis and cleaning of data), Power BI / Excel(for building dashboard)]
I’d love to hear your thoughts or feedback on the dashboard design!
must visit my github for full project -( https://lnkd.in/dYKdZ8J2
)
0
67
Data Analytics Project | BlinkIT Grocery Sales Analysis
Excited to share my latest Data Analytics project ,where I analyzed BlinkIT Grocery Sales Data and delivery data to uncover meaningful business insights 📈
📊 What I worked on:
Analyzed sales performance across product categories, outlet types, sizes, and locations
Identified top-performing item categories and customer preferences
Studied the impact of outlet size, establishment year, and visibility on sales
Converted raw data into actionable insights and business recommendations
💡 Key Insights:
Fruits & Vegetables, Snack Foods, and Frozen Foods drive maximum sales
Medium-sized outlets outperform others in overall revenue
FOR FULL PROJECT VIST GIT HUB –( https://lnkd.in/d34sdAPz
)
Feedback and suggestions are always welcome!
1
1
87