
harris shahbaz
Power BI Developer for Ongoing Business Reporting & Analytic
New to Contra
harris is building their profile!
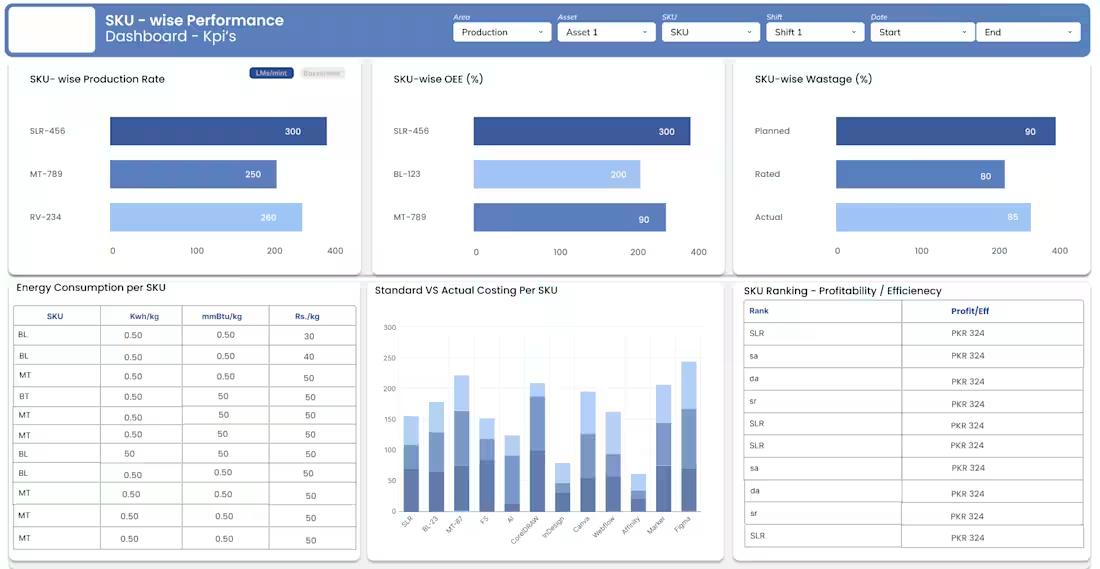
Designed and developed a multi-page Power BI dashboard for a manufacturing operations client in the GCC region. Page 1 delivers real-time OEE KPIs — Availability, Performance, and Quality — with planned vs rated vs actual comparisons across Production, Quality, and Duration. Integrated a leading downtime causes trend and a ranked fault table for root-cause visibility. Page 2 drills into SKU-level intelligence: production rates, OEE %, wastage %, energy consumption per SKU (Kwh/kg, mmBtu/kg), standard vs actual costing, and a profitability/efficiency ranking table. Built with dynamic slicers for Area, Asset, SKU, Shift, and Date range.😍
2
1
74
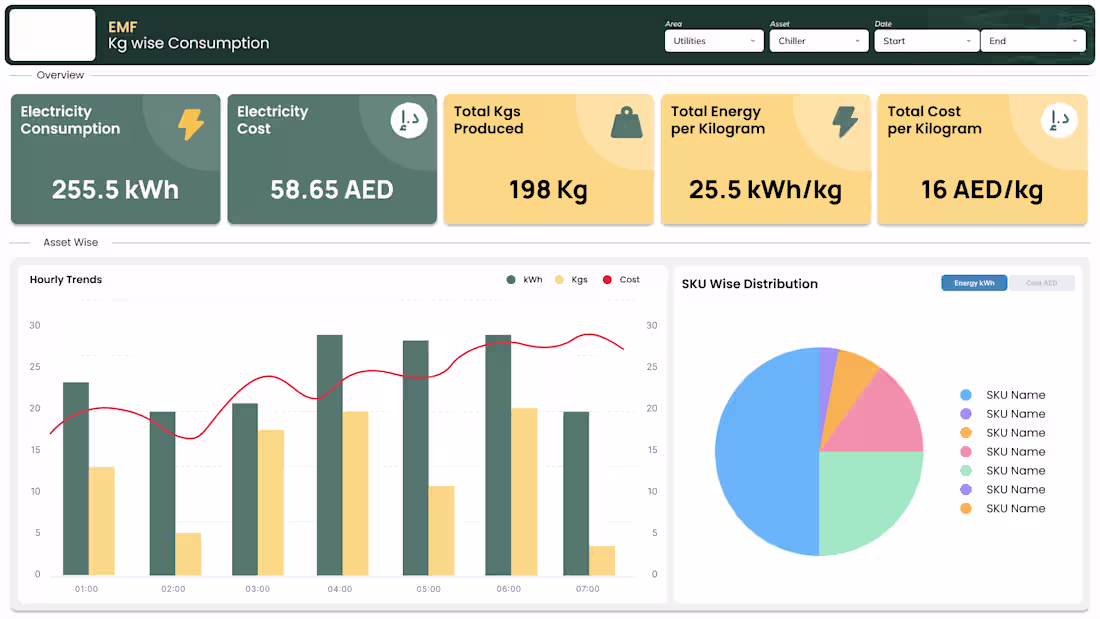
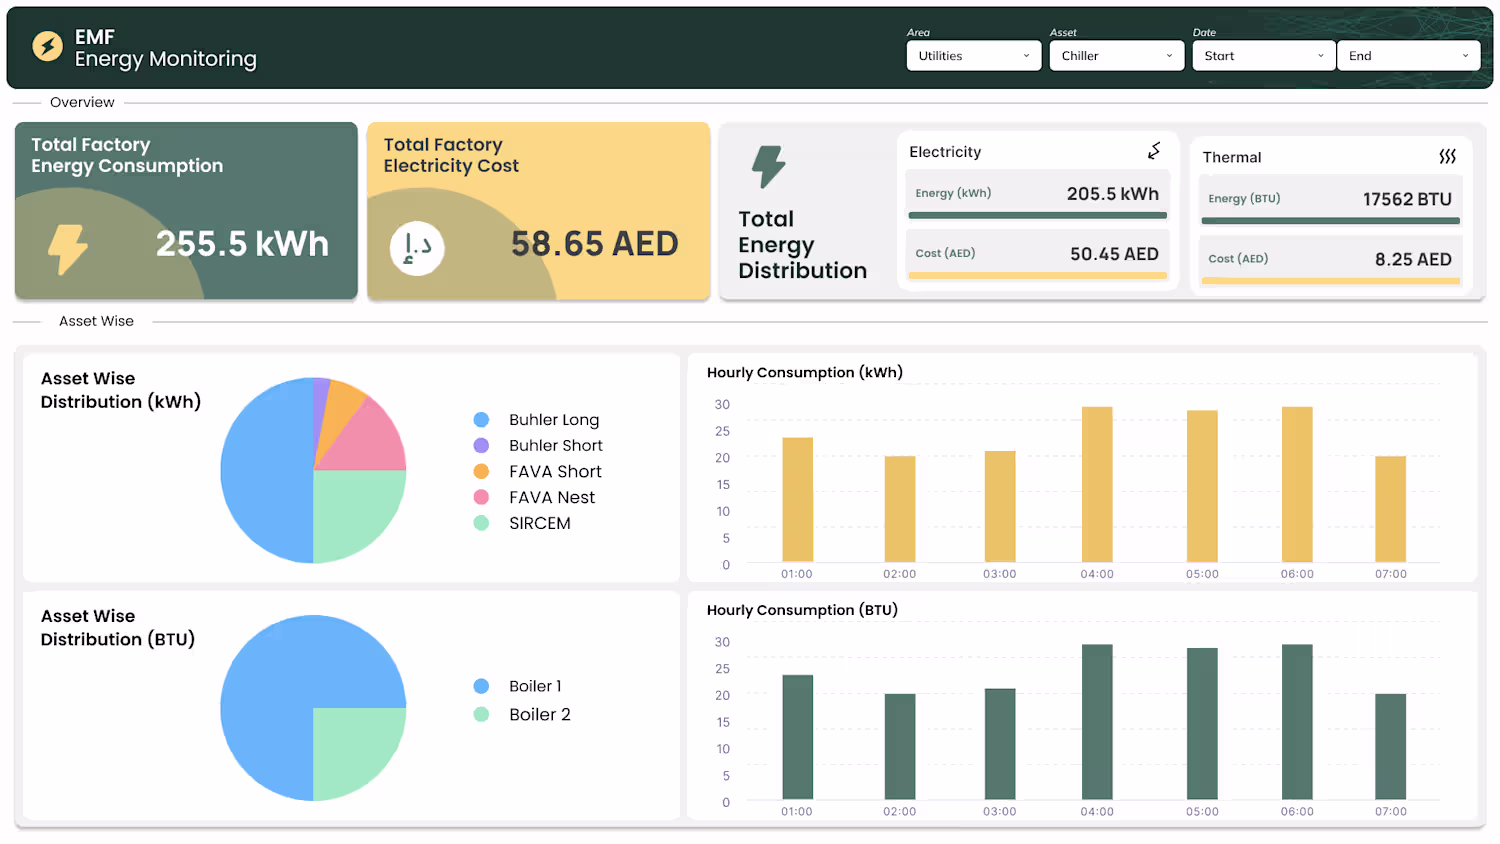
A UAE factory had no visibility into energy costs across production assets data was scattered across manual logs.
I built an interactive Power BI dashboard that centralizes all energy data into one executive view.
It tracks total consumption (kWh), electricity costs (AED), and thermal usage (BTU) with filters by Area, Asset, and Date. Includes asset-wise breakdowns, hourly trends, and cost-per-kilogram analysis.
Need a clean, optimized dashboard like this? Let's build one for you.
2
90