Senior Data Analyst | Business Intelligence Consultant
View more →
Data Analyst: Transforming Insights 📊
Data Scientist, Backend Engineer, Data Analyst


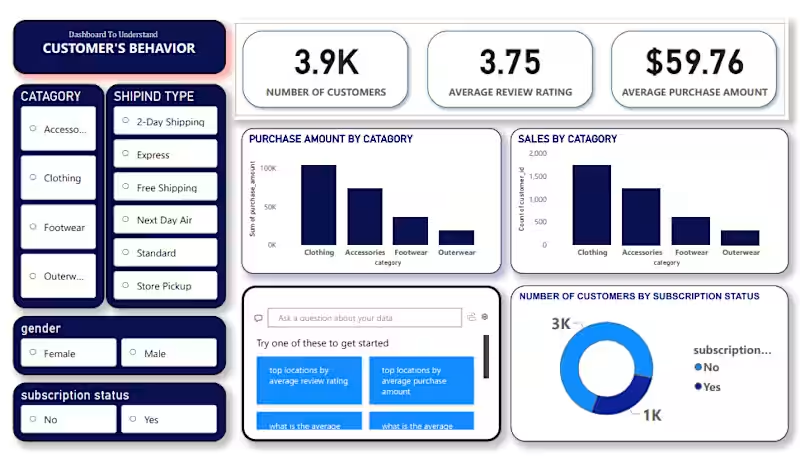
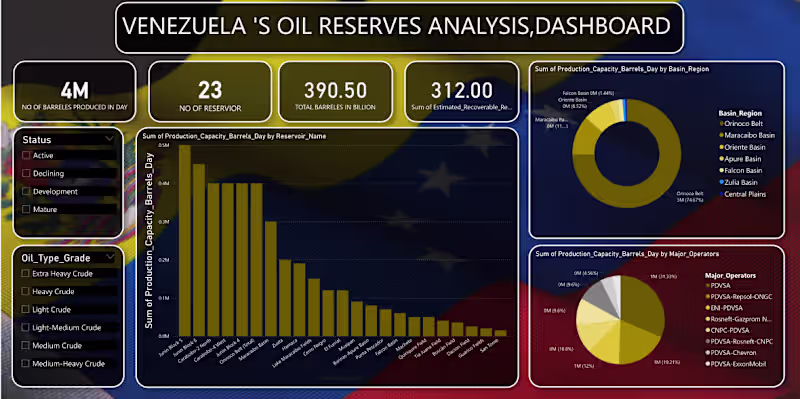
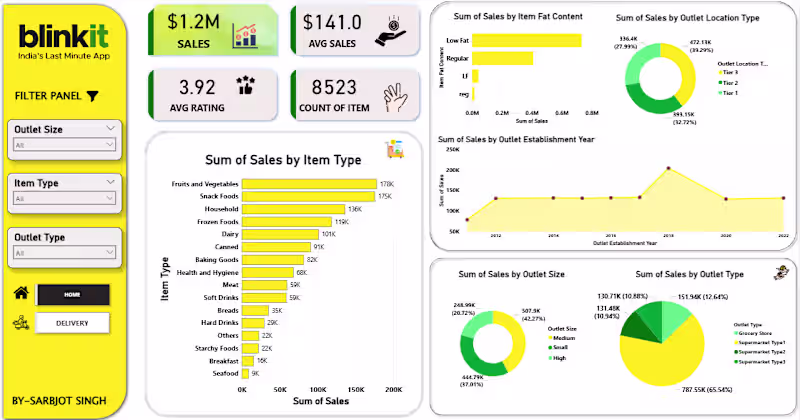
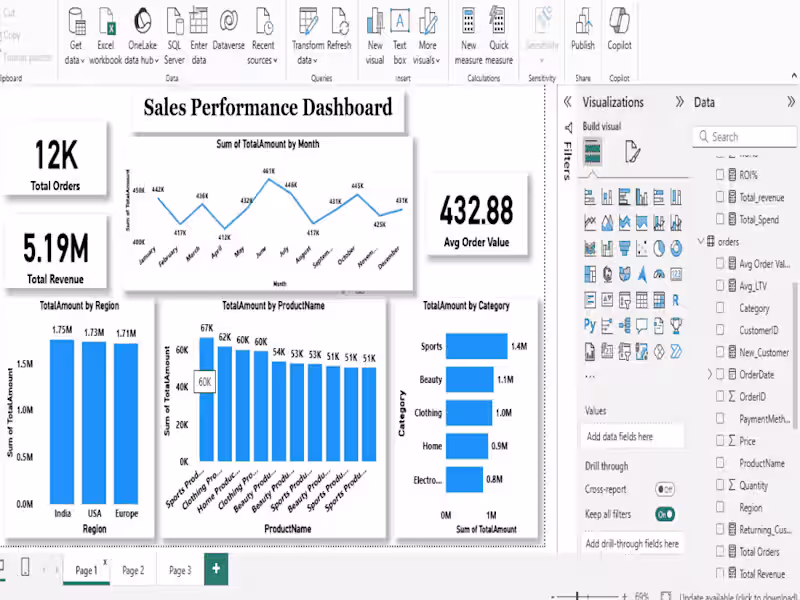
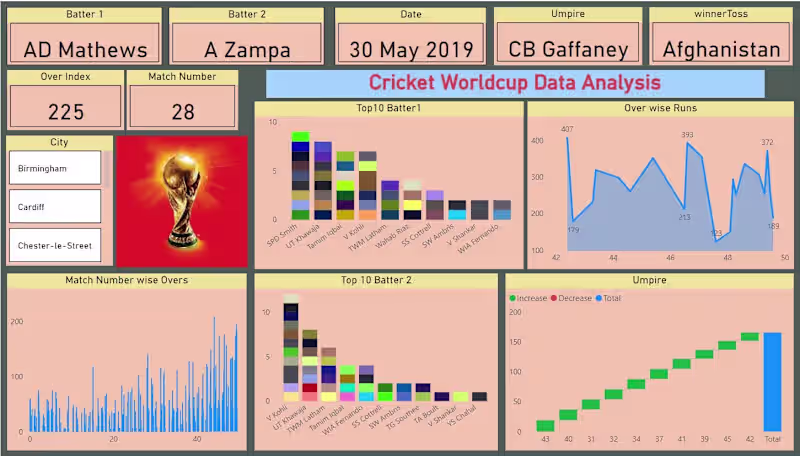
Power BI Data Analyst turning data into insights
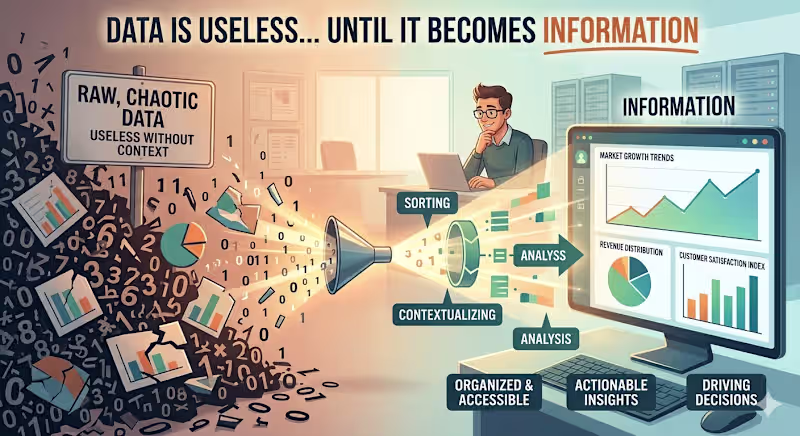

Power BI Expert | Turning Raw Data into Actionable Insights
New to Contra
Power BI Expert | Turning Raw Data into Actionable Insights
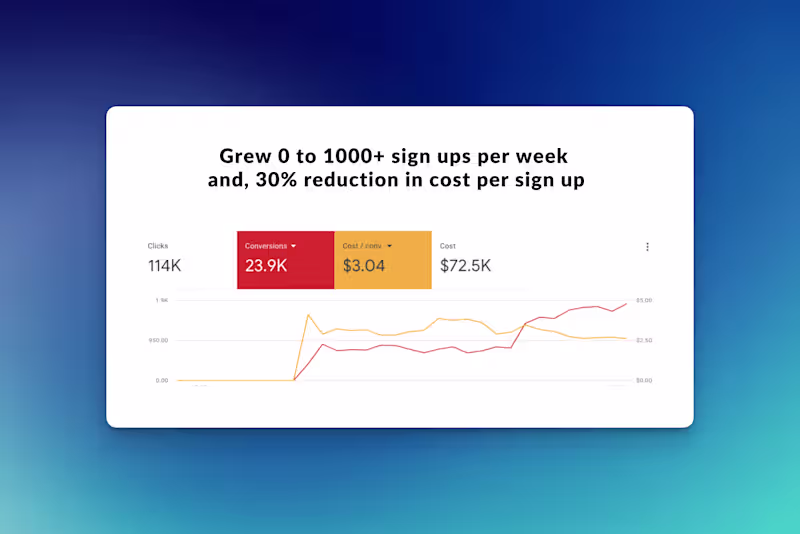
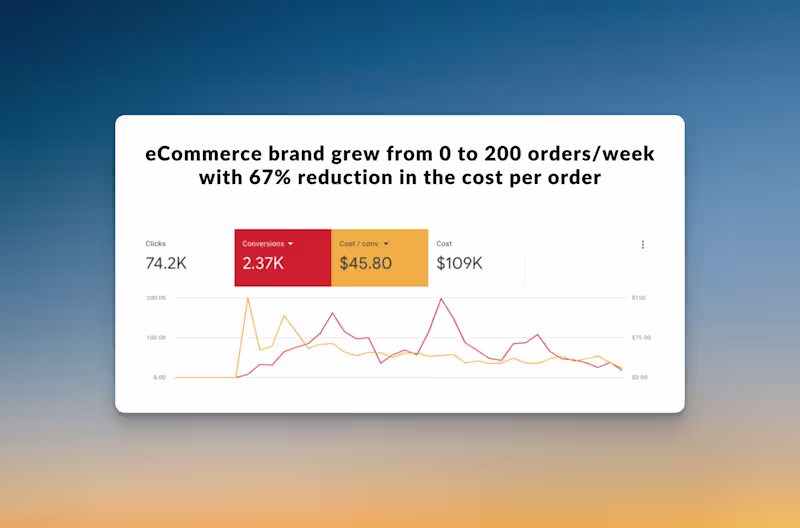
Your CRO and Paid Ads Growth Partner | Startups & Enterprise
Your CRO and Paid Ads Growth Partner | Startups & Enterprise


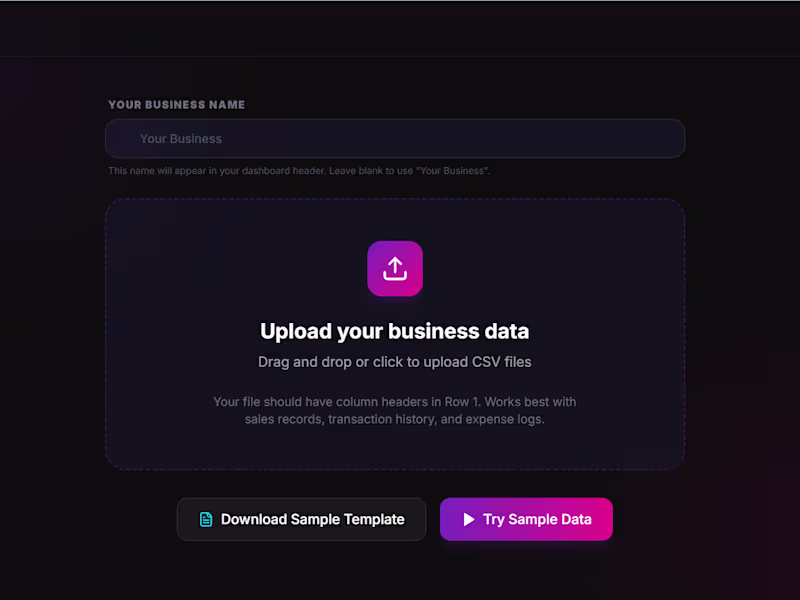
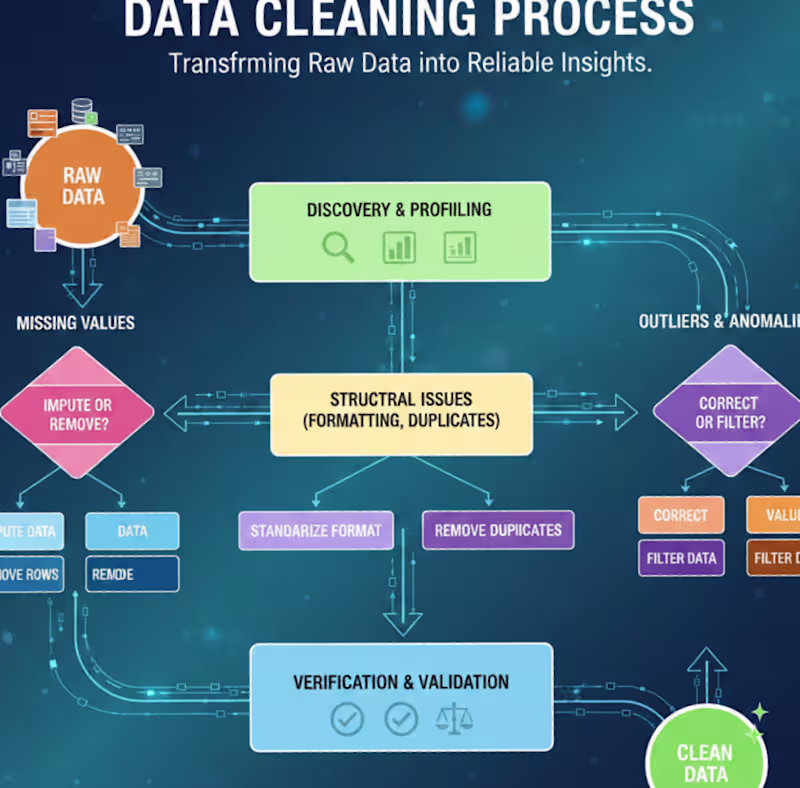
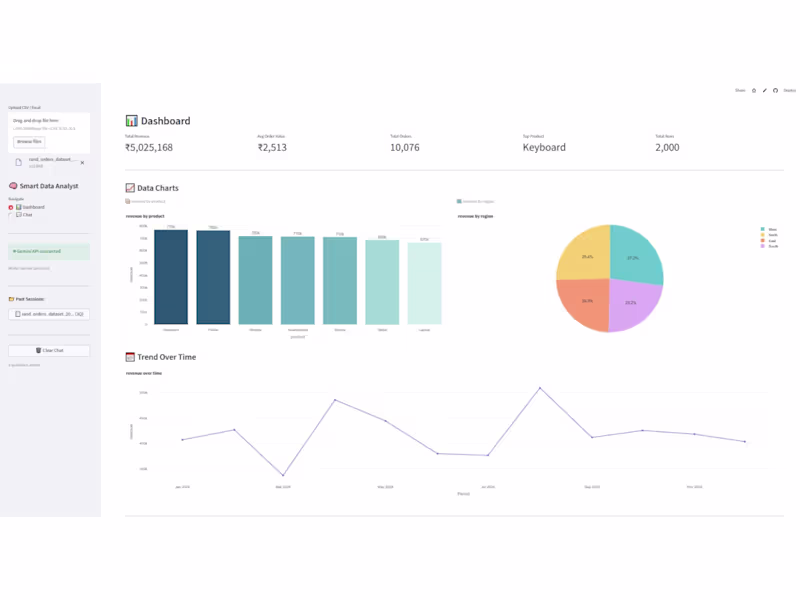
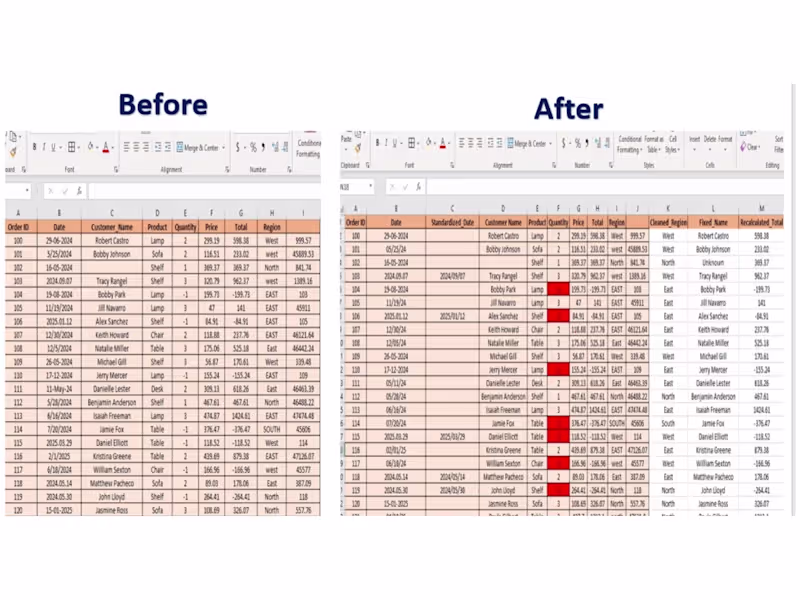
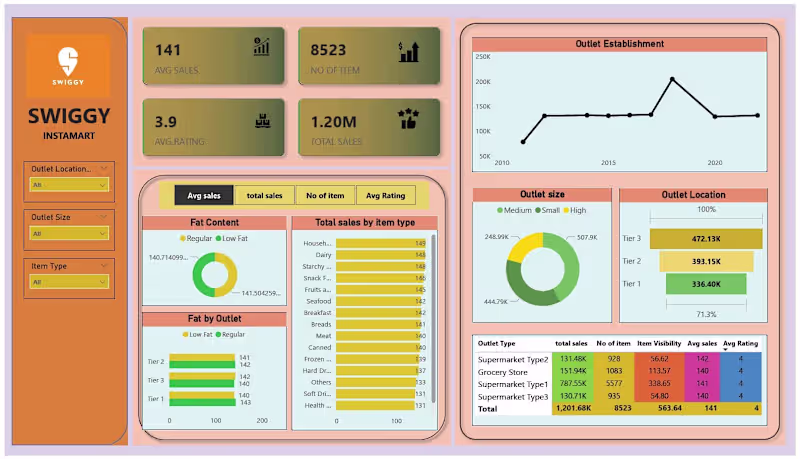
I help businesses fix messy data and build dashboards
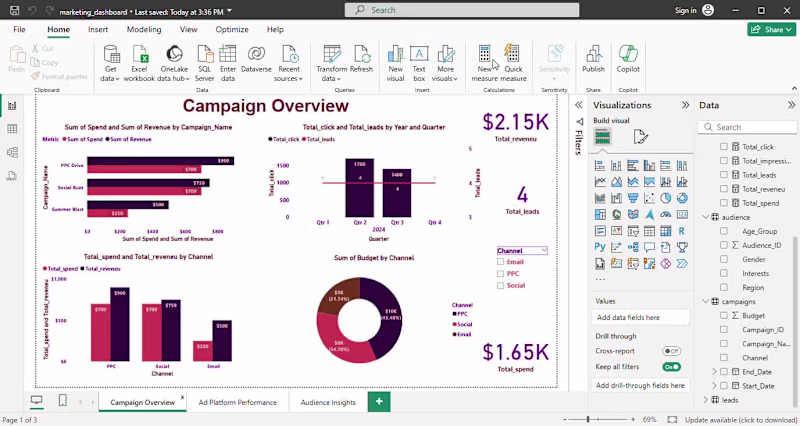
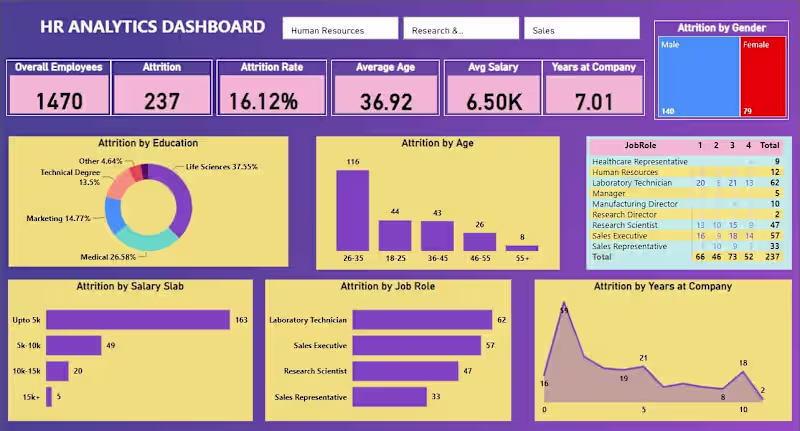
MS PowerBI certified DataAnalyst | Get results, improvements
MS PowerBI certified DataAnalyst | Get results, improvements
View more →