SuperStore Sales Dashboard and Forecasting | Power BI
Rohit Poddar
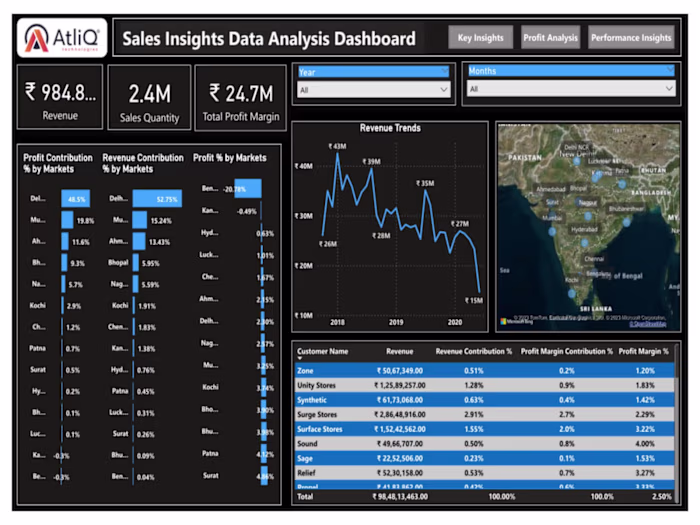
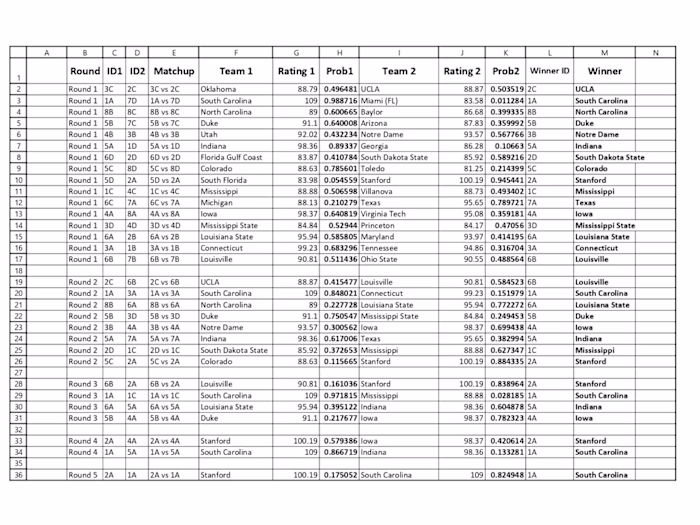
- Incorporated Data Analysis Techniques:
• Applied a variety of data analysis techniques to extract meaningful insights from the available datasets.
• Specialized in time series analysis, a crucial method for understanding trends and patterns over time.
- Valuable Insights:
• Utilized the applied data analysis techniques to derive valuable insights relevant to the business context.
• Unearthed hidden patterns and correlations within the data, contributing to a deeper understanding of critical factors.
- Accurate Sale Forecasting:
• Leveraged time series analysis to enhance the accuracy of sales forecasting.
• The application of this technique facilitated a more precise prediction of future sales trends, aiding in proactive decision-making.
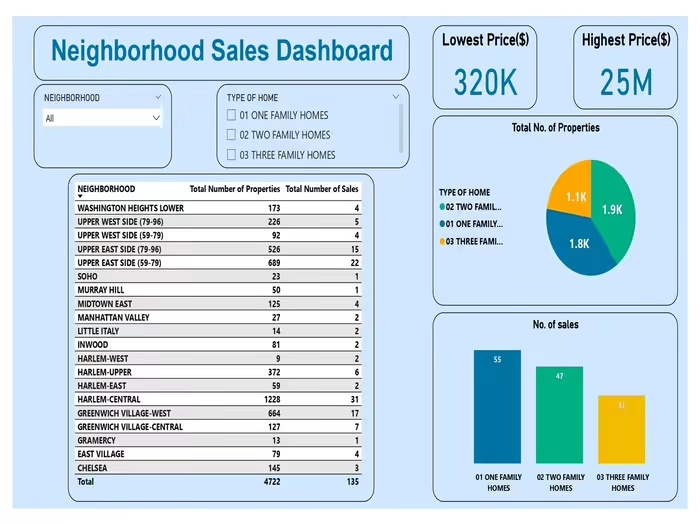
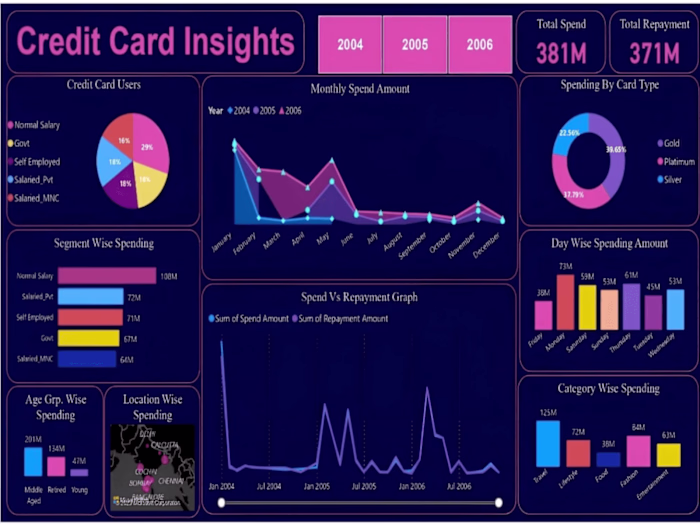
- Interactive Dashboard Creation:
• Employed the insights gained to create interactive dashboards.
• The dashboards served as a user-friendly interface, allowing stakeholders to dynamically explore and interpret the data.
- Driving Business Success:
• The culmination of these efforts played a pivotal role in driving business success.
• The combination of accurate forecasting, insightful data analysis, and interactive dashboards contributed to informed decision-making and overall business growth.
Like this project
Posted Feb 21, 2024
Applied data analysis, specializing in time series, for valuable insights. Enhanced sales forecasting accuracy, translating findings into interactive dashboards
Likes
0
Views
36