Revolutionizing Sales Intelligence with Data | Power BI
Rohit Poddar
AtliQ Hardware, headquartered in Delhi, India, initiated a transformative endeavor to redefine the landscape of sales tracking and insights. Confronting challenges in a dynamic market, our Sales Director sought a solution to facilitate informed decision-making, giving rise to the inception of the Sales Insights Dashboard project.
Key Objectives:
• Develop an innovative dashboard for real-time sales insights.
• Attain a 10% cost reduction, validated by our exceptional sales team.
• Streamline manual data gathering by 20%, empowering our team for strategic initiatives.
Data Analysis Highlights:
• Meticulously refined 'sales market' and 'sales transactions' tables for pristine data.
• Employed SQL expertise for customer records, market-specific transactions, and revenue analysis.
• Implemented crucial metrics such as profit
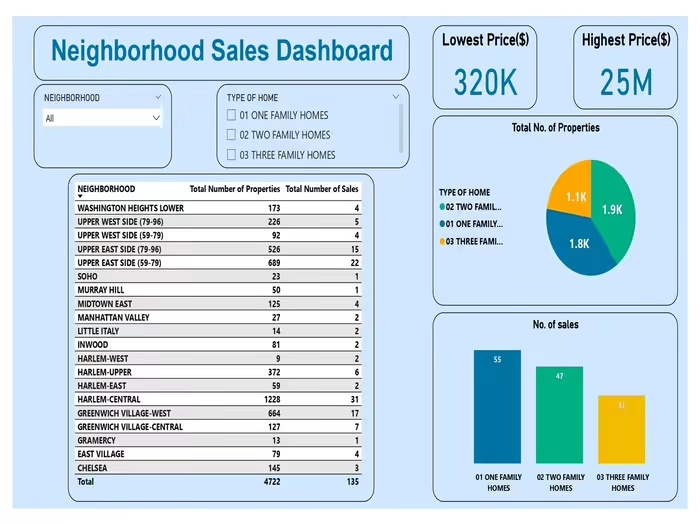
Dashboard Design: Visual Feast for Insights!
• Captivating Revenue and Sales Quantity Trends charts for quick dynamics assessment.
• Top 5 Customers spotlight and Revenue by Product Code for granular insights.
• Geographical perspectives with Sales Quantity and Revenue by Markets charts.
• Metrics Cards displaying key figures and a slick slicer for interactive data analysis.
Benefits:
Comprehensive insights for swift decision-making.
Visual presentation for easy assessment.
Time and cost savings for enhanced efficiency.
Conclusion: Empowering Decision-Makers!
The AtliQ Hardware Sales Insights Dashboard empowers our Sales Director to swiftly tackle declining sales, thanks to accurate data and data-driven insights. Dive into the report for a detailed look at our SQL commands and DAX queries!
Like this project
Posted Feb 21, 2024
AtliQ Hardware transforms sales tracking with the Sales Insights Dashboard project. Real-time insights, 10% cost reduction, and 20% streamlined data gathering.
Likes
0
Views
29