The network for creativity
Join 1.25M professional creatives like you
Connect with clients, get discovered, and run your business 100% commission-free
Creatives on Contra have earned over $150M and we are just getting started
Back to feedPost
Superstore Sales Dashboard — 3-Page Power BI Report
Built an interactive 3-page Power BI dashboard using
the Superstore Sales dataset (9,994 orders across USA).
Page 1 — Sales Overview: KPI cards, monthly trend,
regional breakdown, category performance.
Page 2 — Product Performance: Top products, category
donut, profit analysis, sales vs profit scatter.
Page 3 — Customer & Shipping: Segment breakdown,
top 10 customers, monthly growth, ship mode distribution.
Tools: Power BI, DAX, Superstore Dataset
Theme: Dark professional with interactive year filter.
The network for creativity
Join 1.25M professional creatives like you
Connect with clients, get discovered, and run your business 100% commission-free
Creatives on Contra have earned over $150M and we are just getting started
Related posts
Title:
Professional Data Entry Project (Microsoft Excel)
Description:
Built a professional Excel-based Data Entry Project for accurate data collection, organization, and management. The project includes structured spreadsheets, automated calculations, data validation, sorting, filtering, and clean formatting to improve efficiency and reduce errors. Designed for businesses to maintain organized records and streamline daily data management tasks.
Skills Used:
Microsoft Excel
Data Entry
Data Cleaning
Data Validation
Data Formatting
Sorting & Filtering
Formulas (SUM, IF, COUNTIF, VLOOKUP/XLOOKUP)
Spreadsheet Management
Data Organization
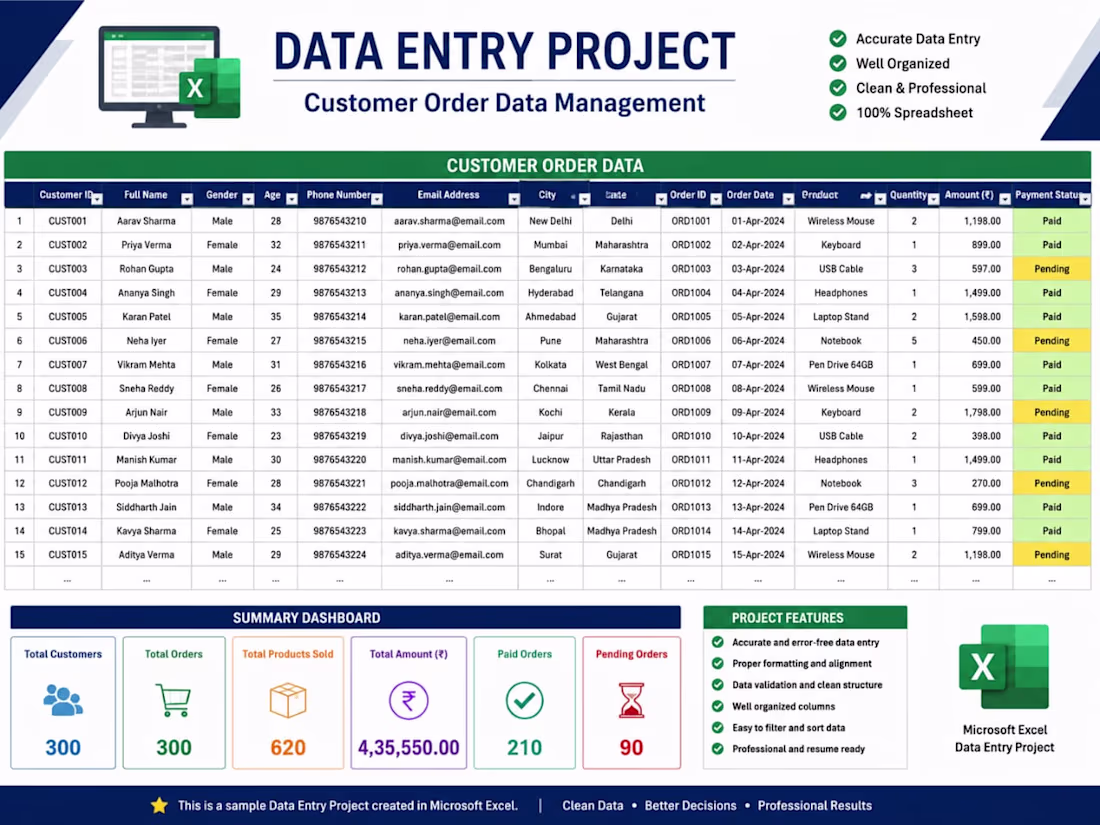
Clean structure and a really practical summary dashboard — the Paid/Pending breakdown is a nice touch for order tracking. Good example of turning raw entries into something genuinely usable.
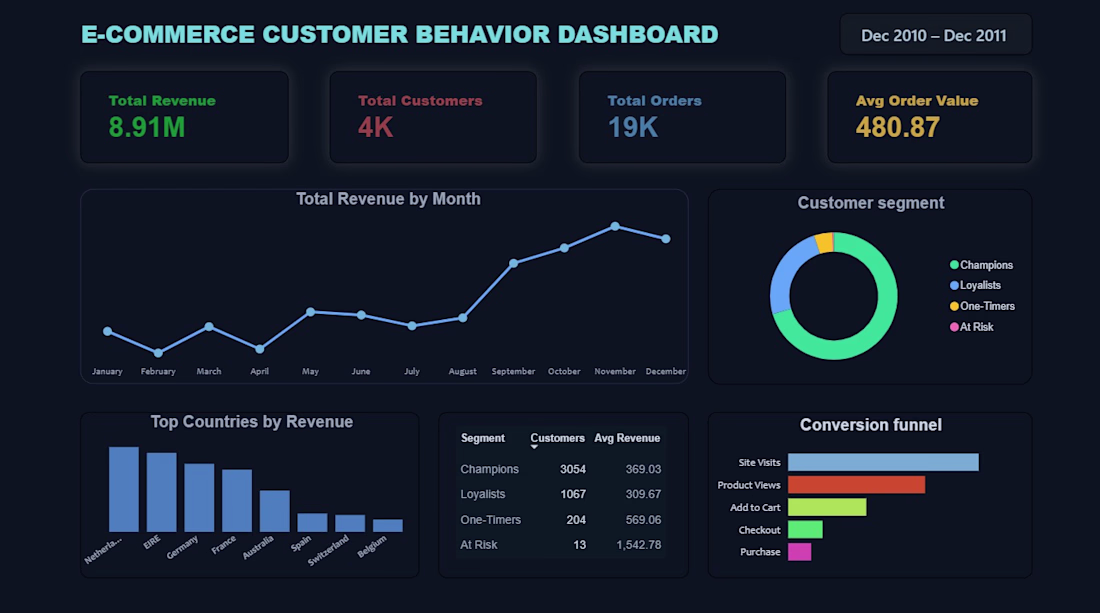
Built an interactive E-Commerce Customer Behavior Dashboard in Power BI to analyze revenue, customer segments, order trends, conversion funnel, and regional performance. Designed to help businesses track KPIs, identify growth opportunities, and make data-driven decisions through clear and actionable visualizations.
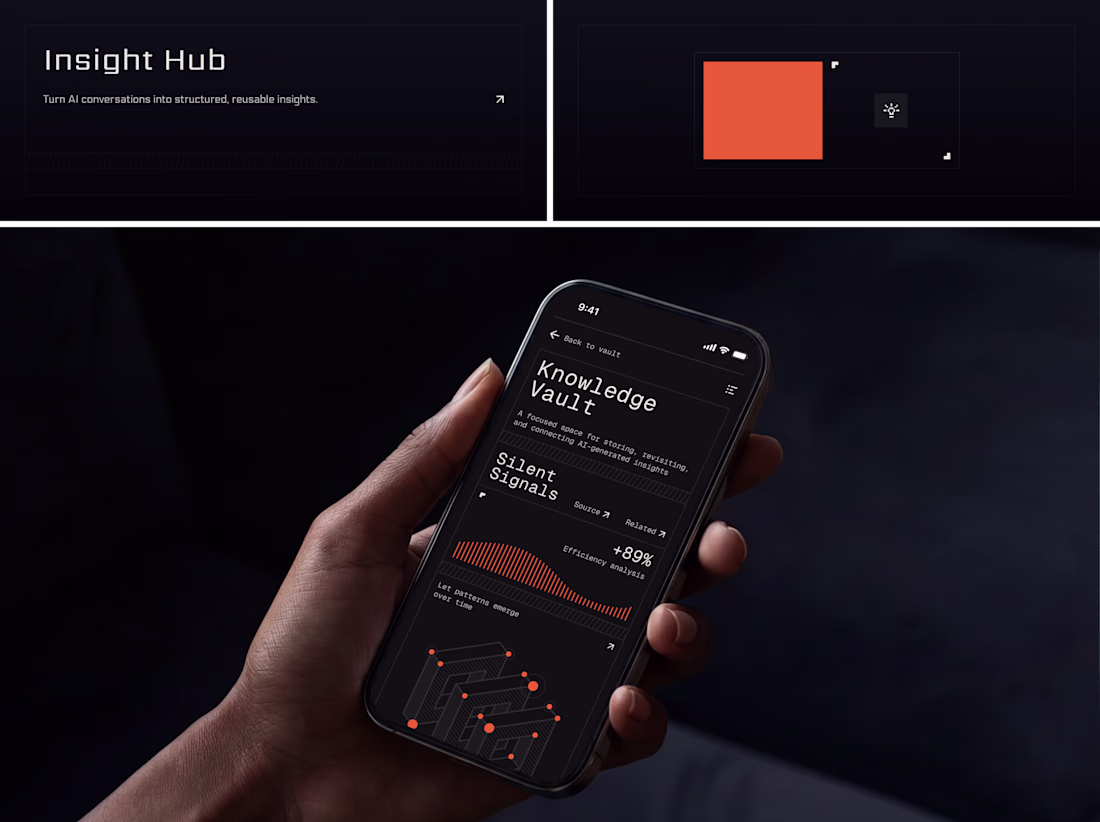
AI Insight Engine
An isometric data map that looks like it belongs in a command center. It's a thinking tool that looks the way thinking feels: structured, quiet, precise.
+89% efficiency analysis. The data proves itself. The design just gets out of the way.
What's the best dark UI you've seen this year?
#UIDesign #DarkUI #AI #SaaS #MobileDesign #ProductDesign #DataVisualization #AppDesign #MonoType #FigmaDesign
Challenges
View allTrending
Claude
Claude has entered the design space. How are you using Claude Design?
Contra University
Learn from expert creatives how to earn more using next-gen AI tools.
fifaworldcup2026
The World Cup is here and the whole world's watching. How are you designing for the world stage?
creativeaiflow
Creative AI workflows are evolving. What tools do you use, and what are their strengths and weaknesses?
freelancerlife
Freelancer life is wins, pivots, and everything in between. What’s yours right now?