
Framer Pro Expert + Shopify Partner


Framer Pro Expert + Shopify Partner


Product Designer · Web & App Developer · AI Automation

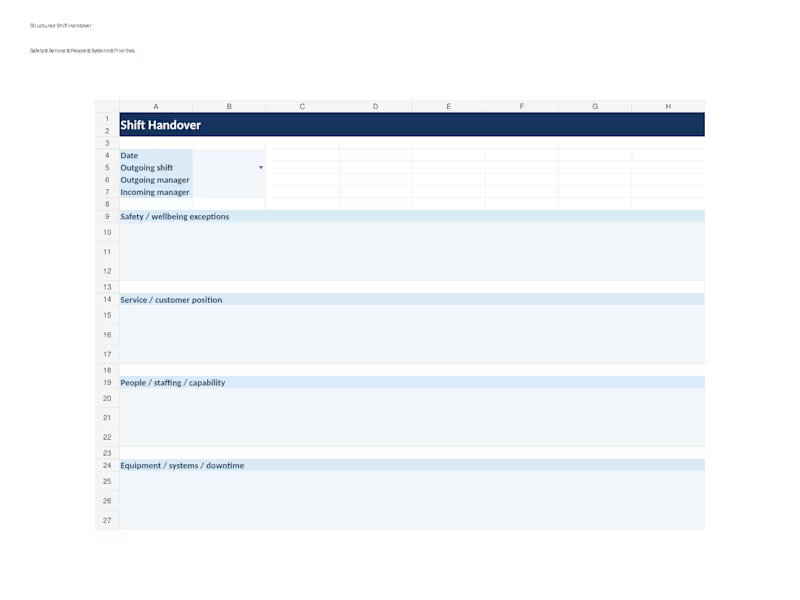
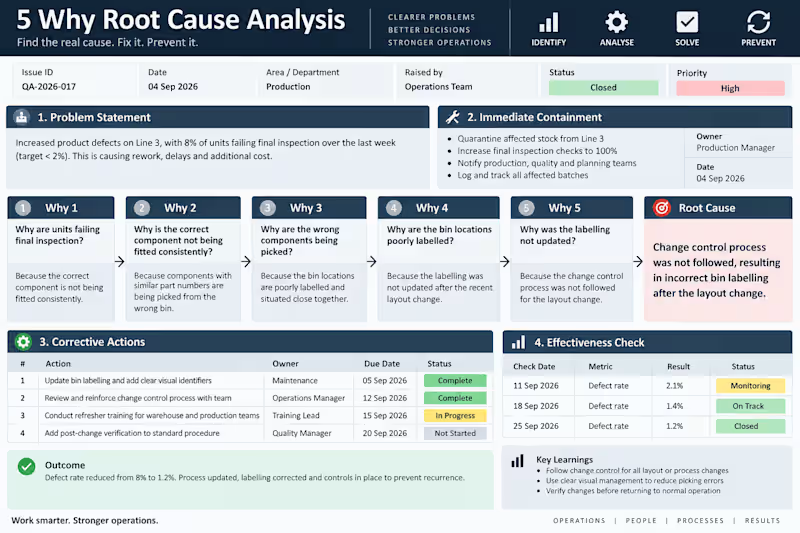
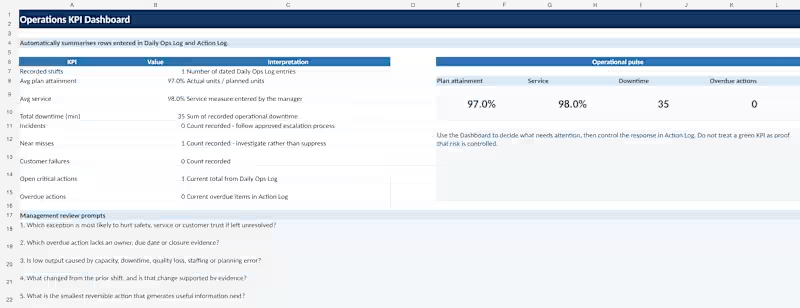
Operations Improvement | Workflow & SOPs


Dashboard Specialist | Looker Studio | Custom Analytics
Dashboard Specialist | Looker Studio | Custom Analytics

Ad Network Publisher Dashboard
Automated publisher dashboard for ad network managing 5+ publishers with monthly revenue tracking.
Part of custom portal system where each publisher gets unique login to view their performance data. Dashboard shows ad requests, impressions, clicks, revenue, eCPM, and CTR with automatic updates from Google Sheets.
Features:
Performance scorecards (requests, impressions, clicks, revenue)
Revenue trends by ad type (Display vs Video)
Detailed performance table by publisher and date
Product-level revenue breakdown
This dashboard is part of a larger system with secure login portal (separate image). Eliminated 10+ hours/week of manual reporting for the client.
Tech: Google Looker Studio, Google Sheets, Cloudflare Pages
Delivery: 7 days (full system)
0
44

Marketing Campaign Dashboard
Marketing performance dashboard tracking multi-channel campaigns for an e-commerce client.
Built custom Looker Studio dashboard connecting Google Ads, Instagram, and Facebook campaigns. Tracks key metrics including CPA, CPC, ROI, revenue, and spend across all channels.
Features:
Real-time campaign performance scorecards
Revenue and ROI tracking by campaign
Channel comparison analysis (Instagram vs Google Ads vs Facebook)
Detailed performance table with all key metrics
Client can filter by campaign, date range, and channel to analyze performance. Dashboard updates automatically when new campaign data is added.
Tech: Google Looker Studio, Google Sheets
Delivery: 3 days
0
42

Ad Network Publisher Dashboard
Automated publisher dashboard for ad network managing 5+ publishers with monthly revenue tracking.
Part of custom portal system where each publisher gets unique login to view their performance data. Dashboard shows ad requests, impressions, clicks, revenue, eCPM, and CTR with automatic updates from Google Sheets.
Features:
Performance scorecards (requests, impressions, clicks, revenue)
Revenue trends by ad type (Display vs Video)
Detailed performance table by publisher and date
Product-level revenue breakdown
This dashboard is part of a larger system with secure login portal (separate image). Eliminated 10+ hours/week of manual reporting for the client.
Tech: Google Looker Studio, Google Sheets, Cloudflare Pages
Delivery: 7 days (full system)
0
75

Sales Funnel Analytics Dashboard
Conversion funnel dashboard for B2B SaaS client tracking leads through to closed deals.
Visual funnel showing progression from website visitors → leads → MQL → SQL → opportunities → closed deals. Includes drop-off rates and conversion percentages at each stage.
Features:
Dual funnel view (sales funnel + leads funnel)
Stage-by-stage performance metrics
Drop-off and conversion rate analysis
Detailed data table with counts and percentages
Client uses this to identify bottlenecks in their sales process and optimize conversion rates at each funnel stage.
Tech: Google Looker Studio, Google Sheets
Delivery: 2 days
0
53

AI Automation & Web Design | n8n · Vapi · Claude API
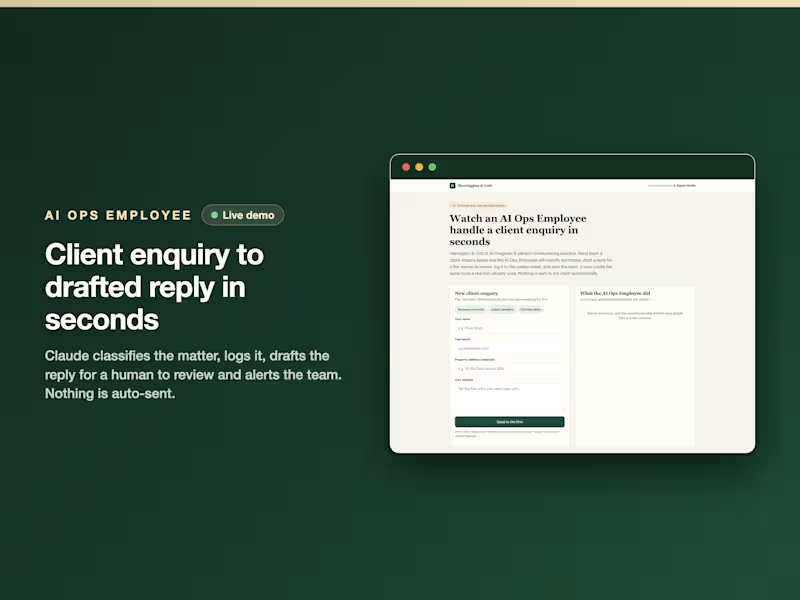
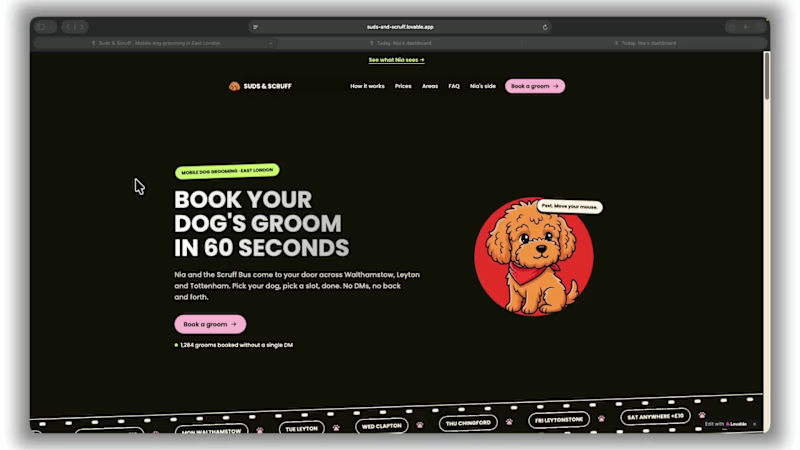
Suds & Scruff Mobile Dog Grooming, Walthamstow, East London
Nia is made up. Her problems aren't.
She grooms dogs from a van across Walthamstow, Leyton and Chingford, and she works an area a day. Enquiries come in by DM while she's mid-groom, so she answers them at 9pm. Getting one dog booked takes about six messages. Two dogs a week don't turn up, and she's already driven there.
What I built:
Customers book themselves. Size and coat set the price and the time, and they only see days when the van is in their area.
If someone would rather message, the message gets a price, real slots and a booking link back in seconds.
The evening before, every customer gets a one-tap "still on?". Say nothing and the slot goes to the next dog on that area's waitlist. Nia gets one line she can undo.
Customers move or cancel their own bookings inside the same rules.
Nia's dashboard only lists what needs her. Everything else is logged with the minutes it saved: about five hours a week.
To see her side, click "See what Nia sees" at the top of the site. It signs you in to a demo account. Texts are simulated and every one is in the Outbox. Demo data resets every night.
2
132
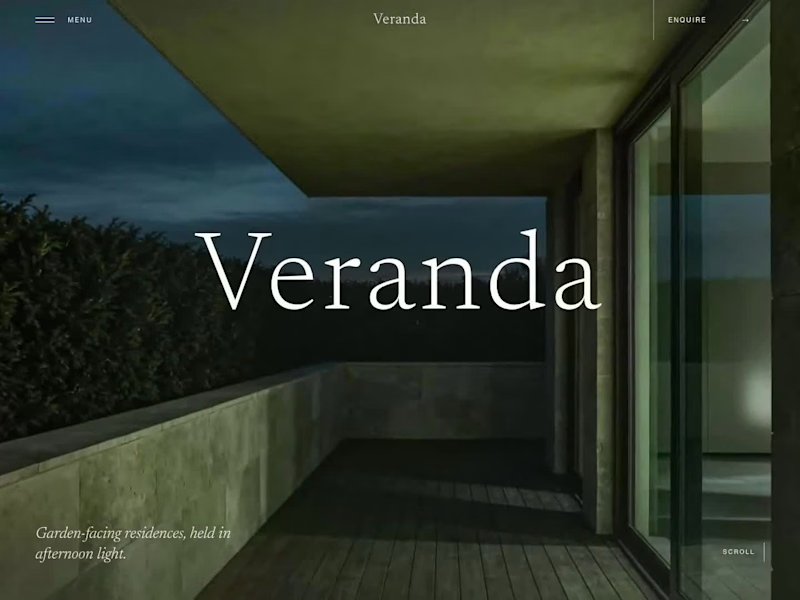
Veranda, a luxury residential concept landing page
Veranda is a concept build I created for a fictional luxury residential brand. It is not client work or a real property. The images and hero motion were generated with AI as part of the creative process.
I wanted to explore something that matters when building high-fidelity landing pages: after several rounds of changes, how do you make sure the final page still looks like the design that was approved?
The site is built in Next.js with responsive layouts, self-hosted fonts, GSAP motion and an interactive walkthrough. I also built in a proper QA process around it, not just checking that the page loads and the buttons work.
It compares 12 sections across five screen sizes against approved visual baselines. It flags visual drift, missing baselines and changes that have not been reviewed. I also tested interactions, accessibility, contrast, performance, browser behaviour and reduced-motion states.
The main lesson for me was simple: a page can pass functional tests and still no longer be the page that was agreed.
22
26
1.3K

AI Implementation, Workflow Automation & Web Design
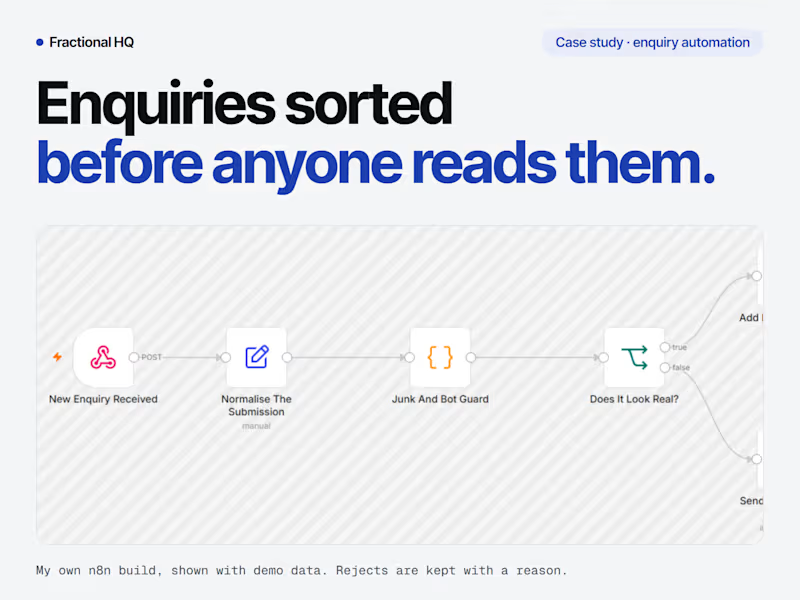
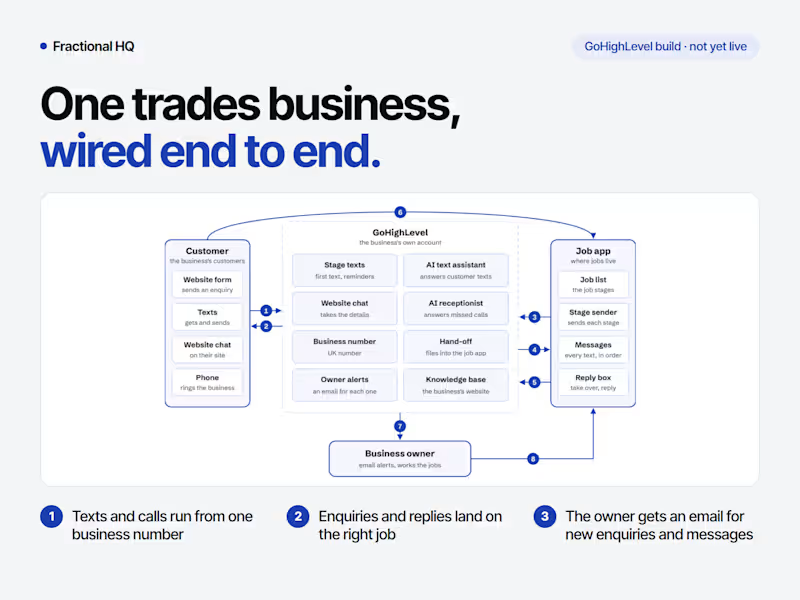
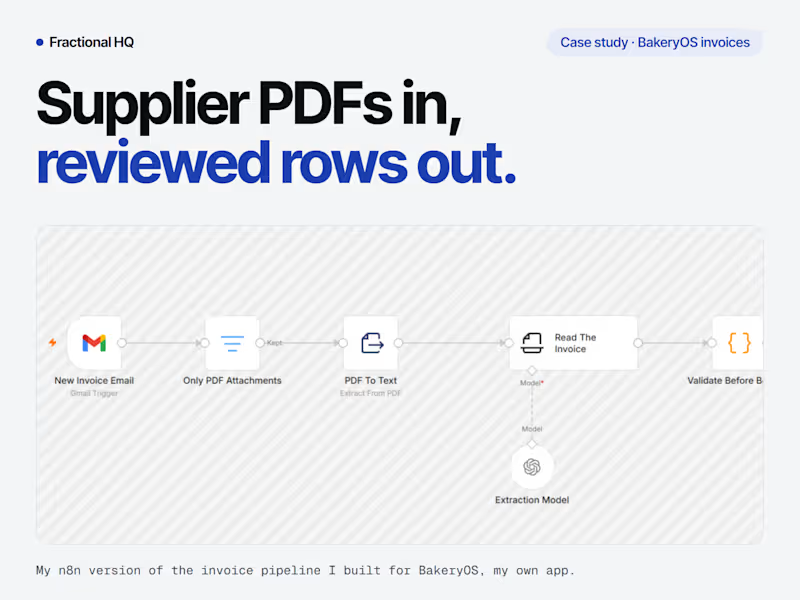

Setting up systems + implementing AI
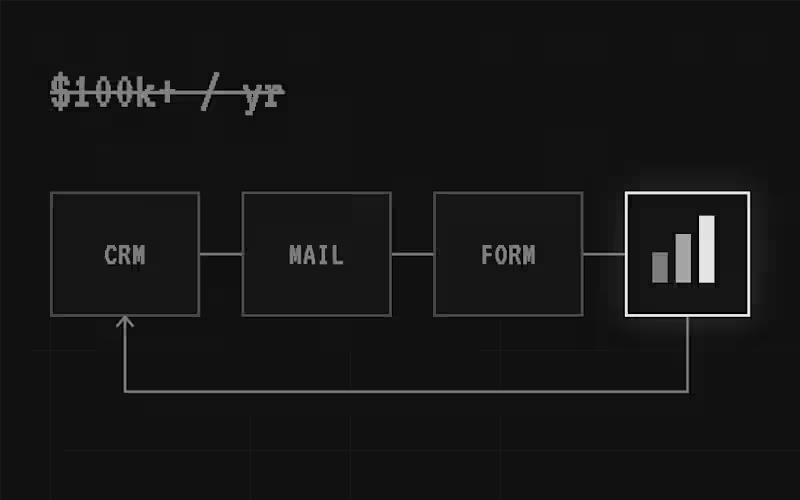




Expert on strategic branding & creative ideation


