
Bryan M
Dashboard Specialist | Looker Studio | Custom Analytics
New to Contra
Bryan is ready for their next project!

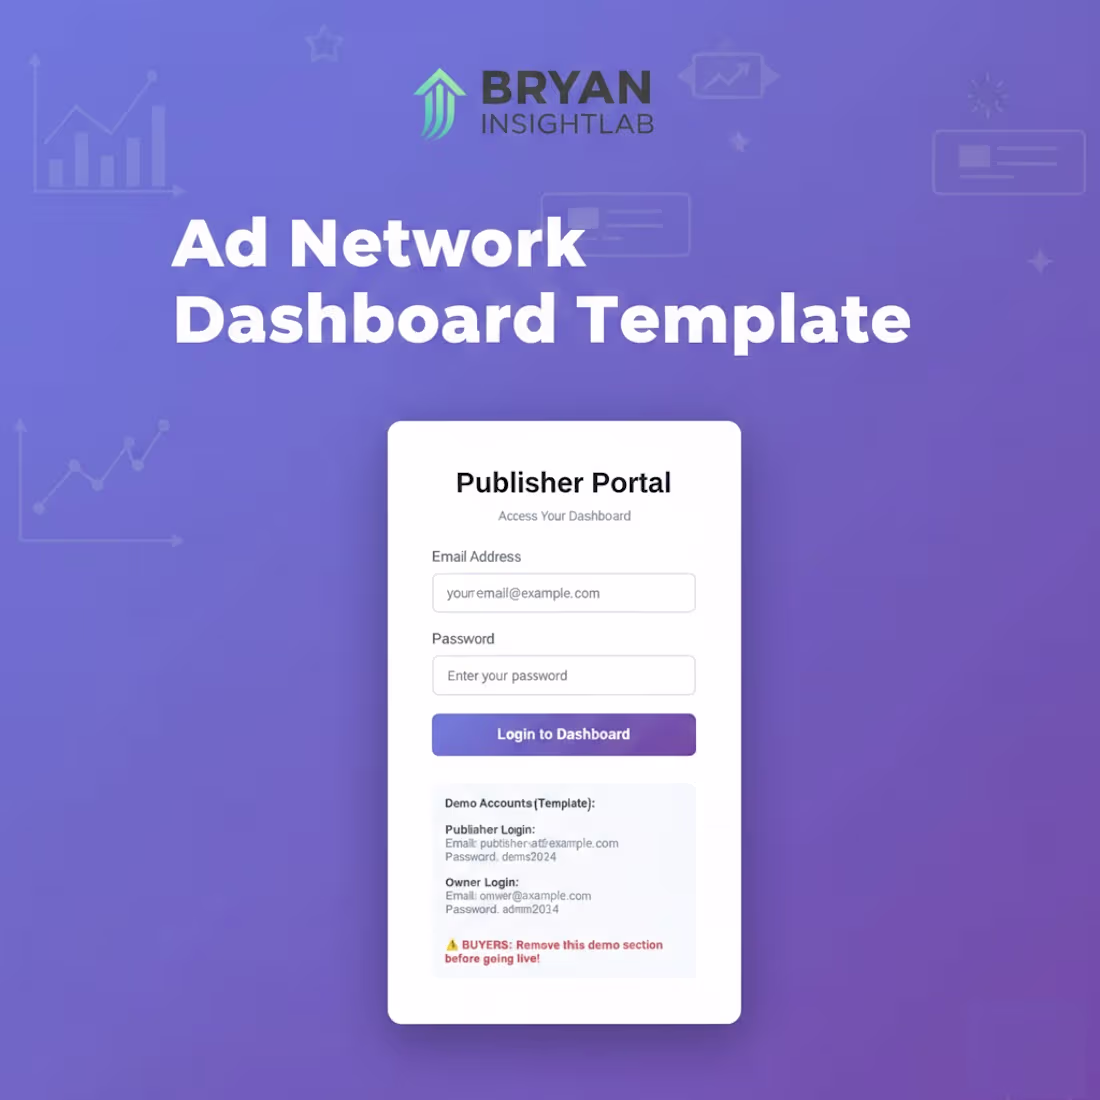
Ad Network Publisher Dashboard
Automated publisher dashboard for ad network managing 5+ publishers with monthly revenue tracking.
Part of custom portal system where each publisher gets unique login to view their performance data. Dashboard shows ad requests, impressions, clicks, revenue, eCPM, and CTR with automatic updates from Google Sheets.
Features:
Performance scorecards (requests, impressions, clicks, revenue)
Revenue trends by ad type (Display vs Video)
Detailed performance table by publisher and date
Product-level revenue breakdown
This dashboard is part of a larger system with secure login portal (separate image). Eliminated 10+ hours/week of manual reporting for the client.
Tech: Google Looker Studio, Google Sheets, Cloudflare Pages
Delivery: 7 days (full system)
0
22
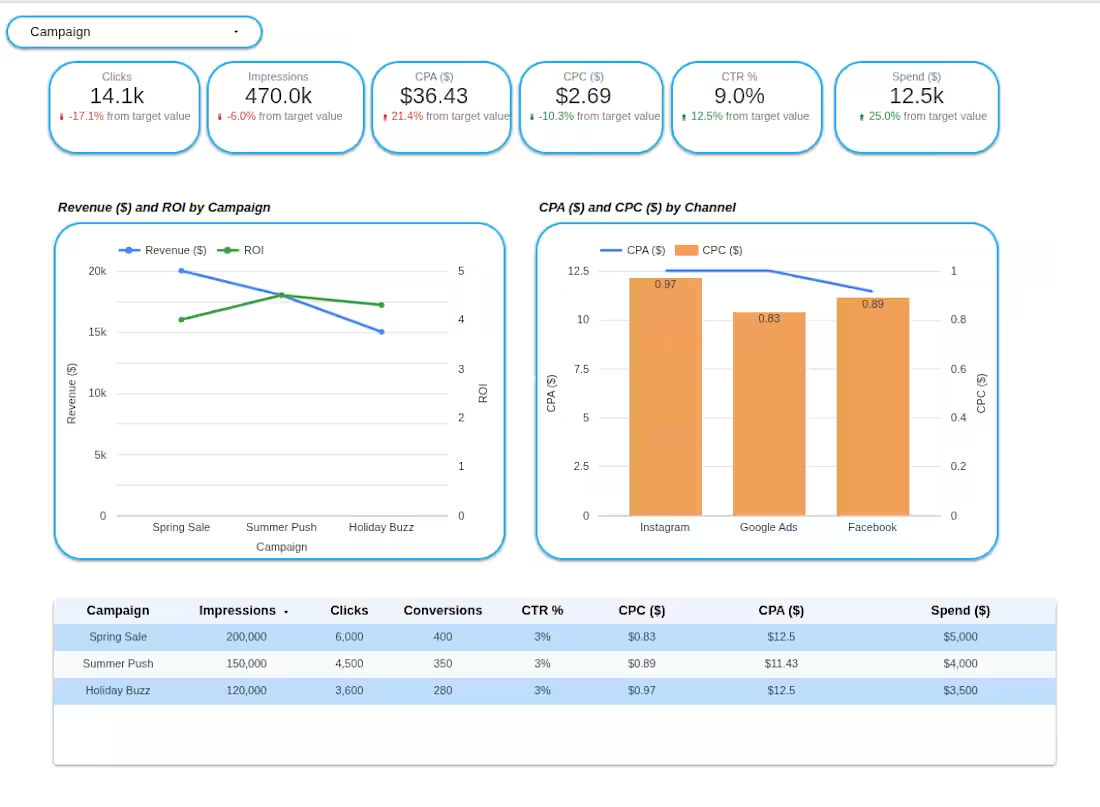
Marketing Campaign Dashboard
Marketing performance dashboard tracking multi-channel campaigns for an e-commerce client.
Built custom Looker Studio dashboard connecting Google Ads, Instagram, and Facebook campaigns. Tracks key metrics including CPA, CPC, ROI, revenue, and spend across all channels.
Features:
Real-time campaign performance scorecards
Revenue and ROI tracking by campaign
Channel comparison analysis (Instagram vs Google Ads vs Facebook)
Detailed performance table with all key metrics
Client can filter by campaign, date range, and channel to analyze performance. Dashboard updates automatically when new campaign data is added.
Tech: Google Looker Studio, Google Sheets
Delivery: 3 days
0
24
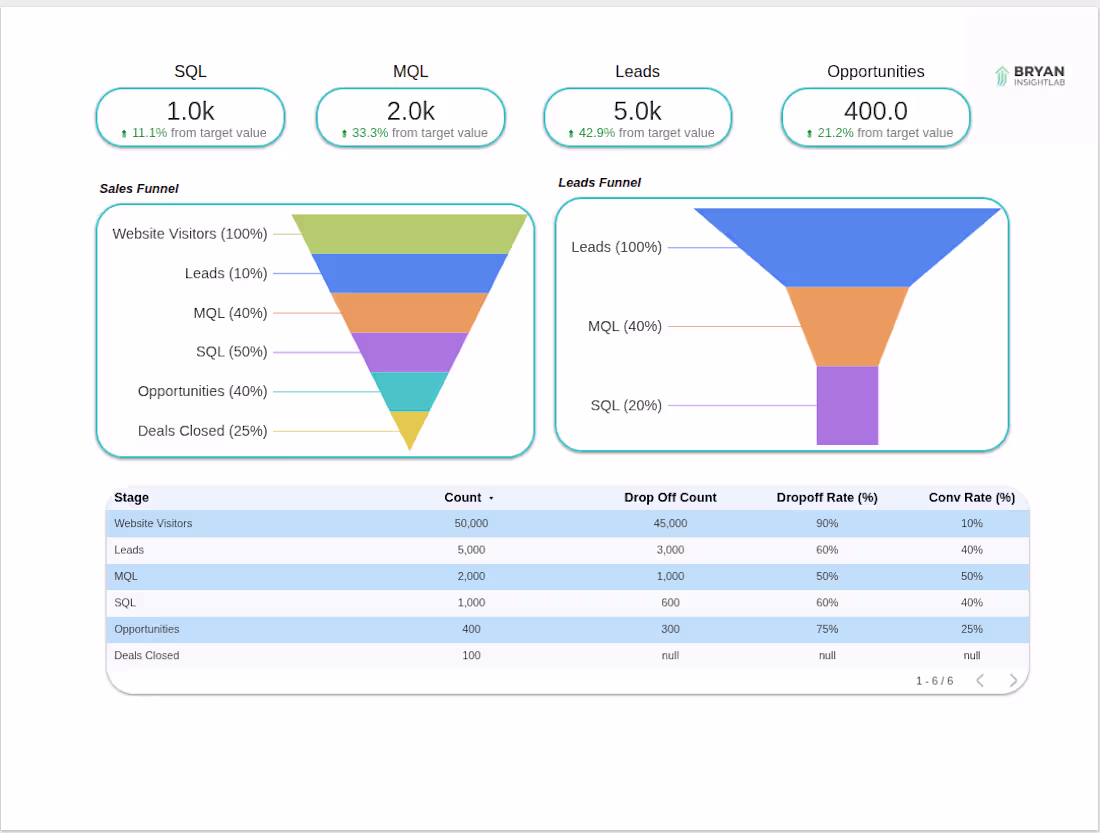
Sales Funnel Analytics Dashboard
Conversion funnel dashboard for B2B SaaS client tracking leads through to closed deals.
Visual funnel showing progression from website visitors → leads → MQL → SQL → opportunities → closed deals. Includes drop-off rates and conversion percentages at each stage.
Features:
Dual funnel view (sales funnel + leads funnel)
Stage-by-stage performance metrics
Drop-off and conversion rate analysis
Detailed data table with counts and percentages
Client uses this to identify bottlenecks in their sales process and optimize conversion rates at each funnel stage.
Tech: Google Looker Studio, Google Sheets
Delivery: 2 days
0
37
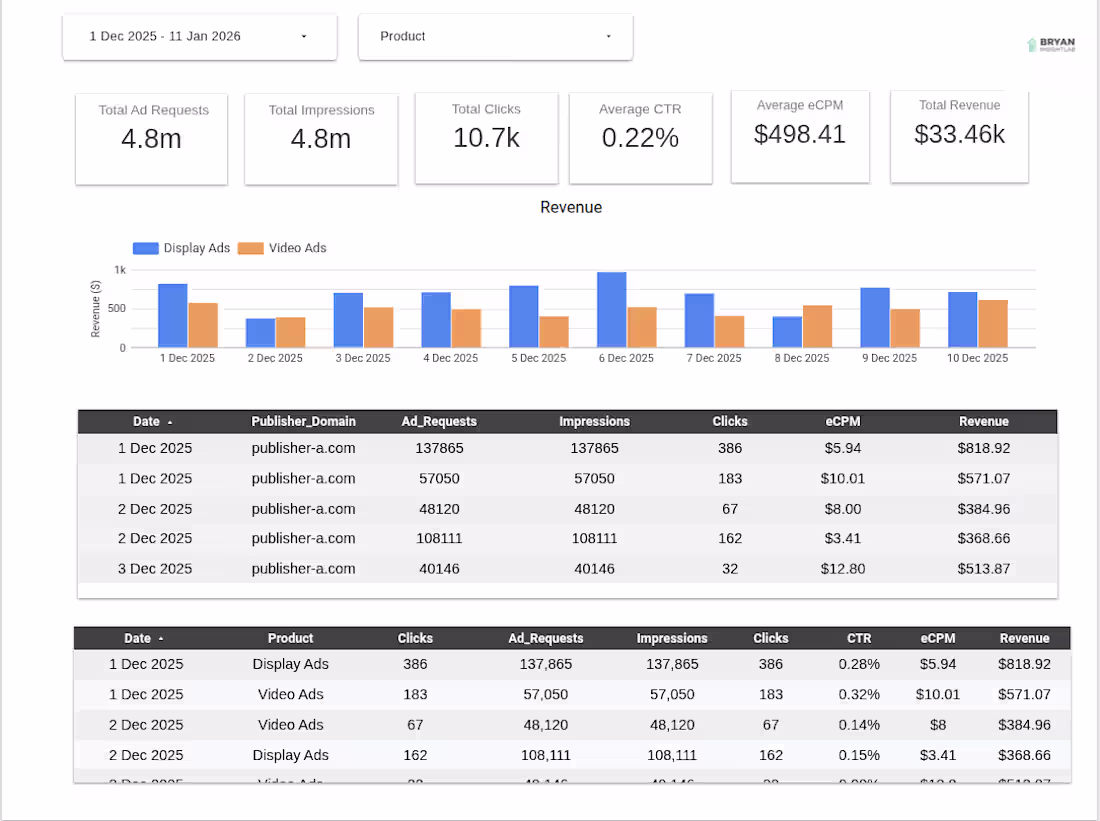
Ad Network Publisher Dashboard
Automated publisher dashboard for ad network managing 5+ publishers with monthly revenue tracking.
Part of custom portal system where each publisher gets unique login to view their performance data. Dashboard shows ad requests, impressions, clicks, revenue, eCPM, and CTR with automatic updates from Google Sheets.
Features:
Performance scorecards (requests, impressions, clicks, revenue)
Revenue trends by ad type (Display vs Video)
Detailed performance table by publisher and date
Product-level revenue breakdown
This dashboard is part of a larger system with secure login portal (separate image). Eliminated 10+ hours/week of manual reporting for the client.
Tech: Google Looker Studio, Google Sheets, Cloudflare Pages
Delivery: 7 days (full system)
0
55