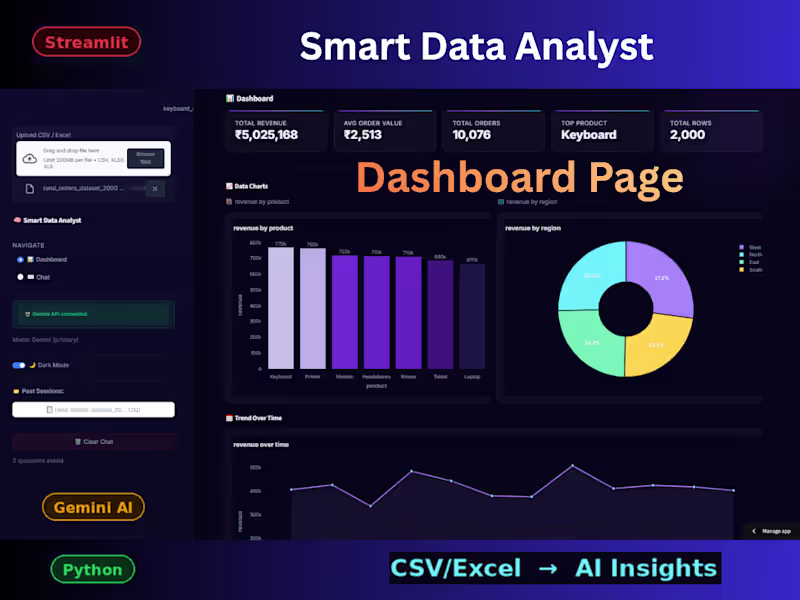
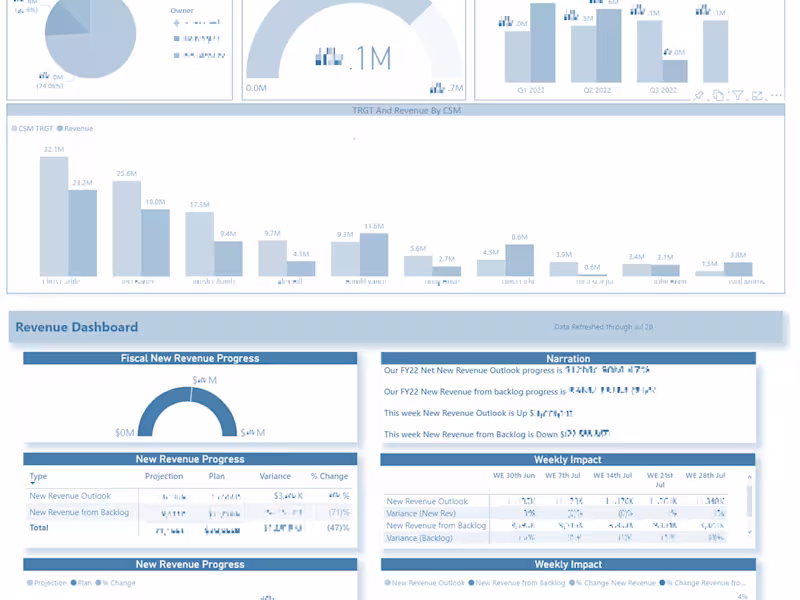
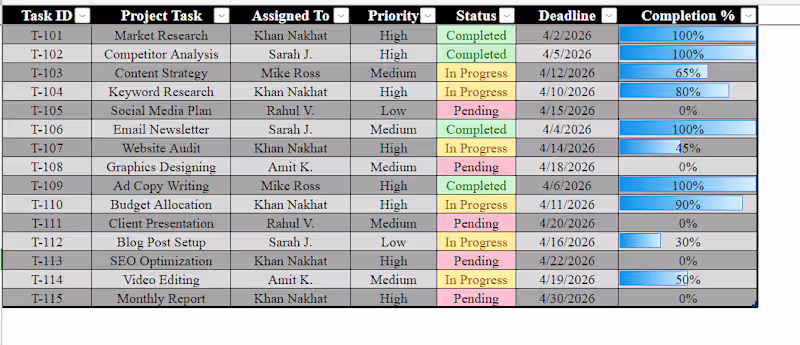
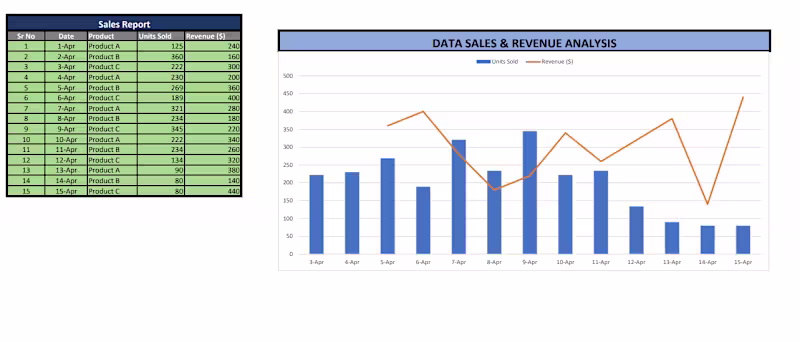
I build AI-powered data apps and dashboards
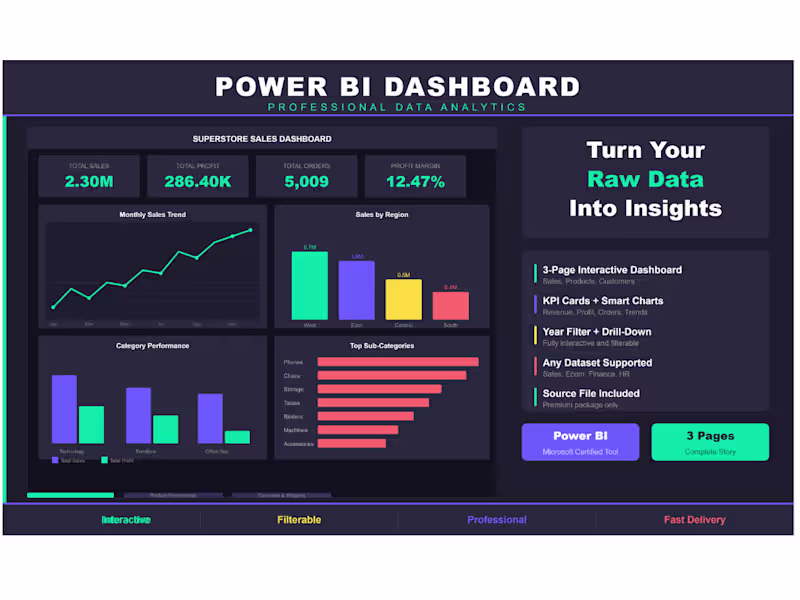
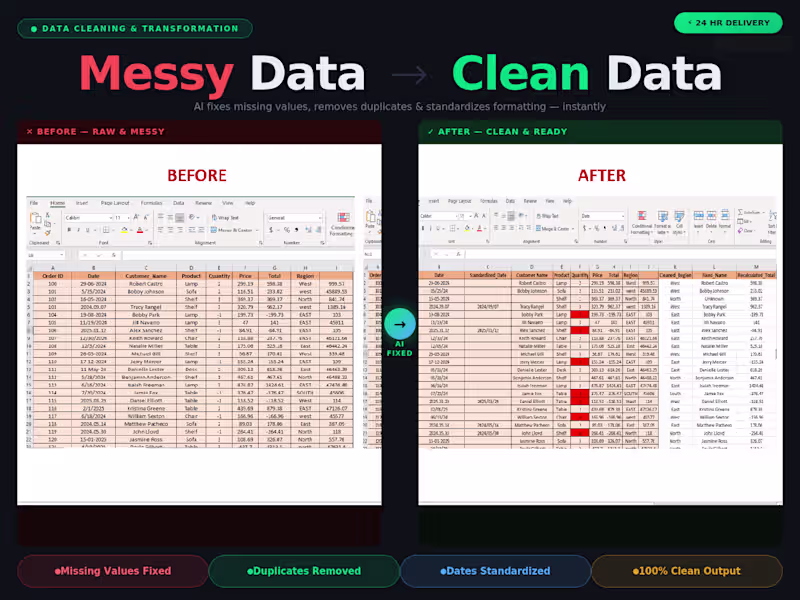
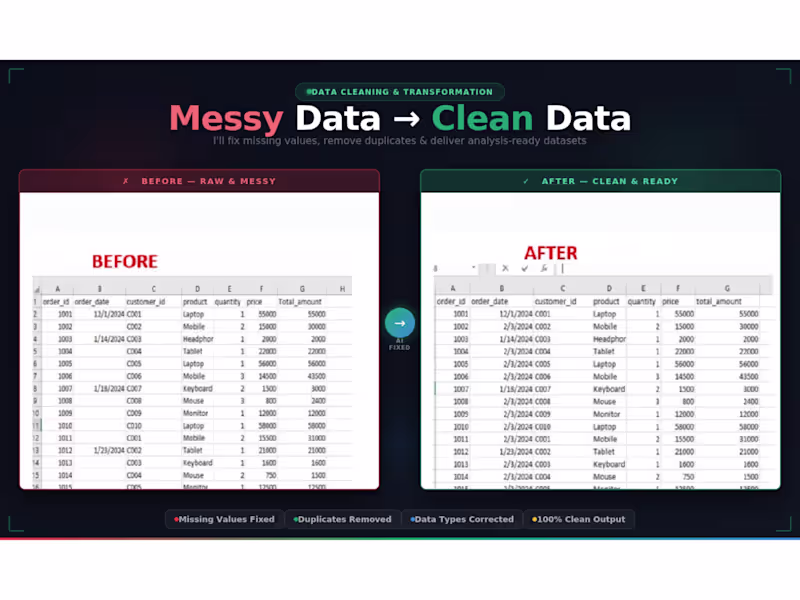
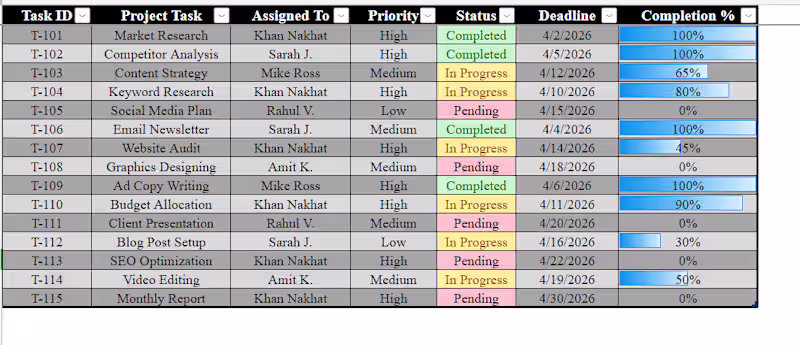
Data Specialist for Clean, Organized & Smart Reports
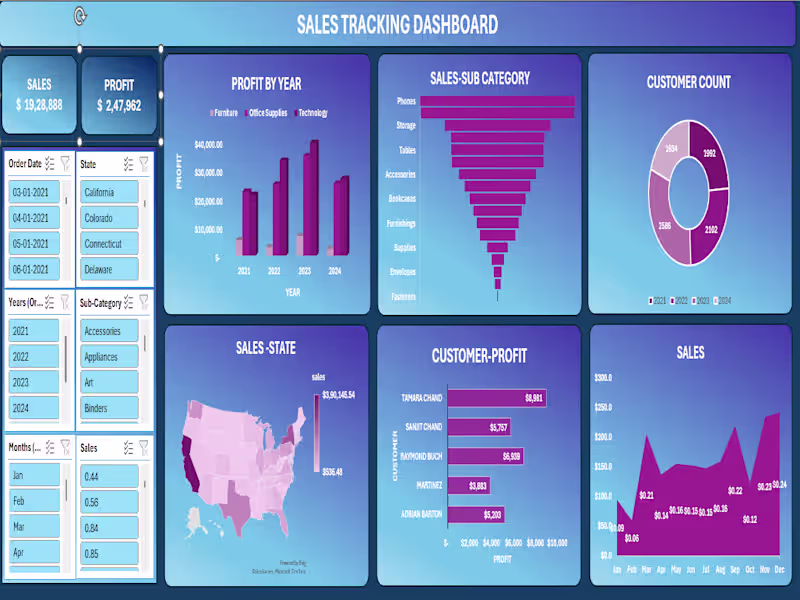
Merging insights with storytelling
Merging insights with storytelling

View more →
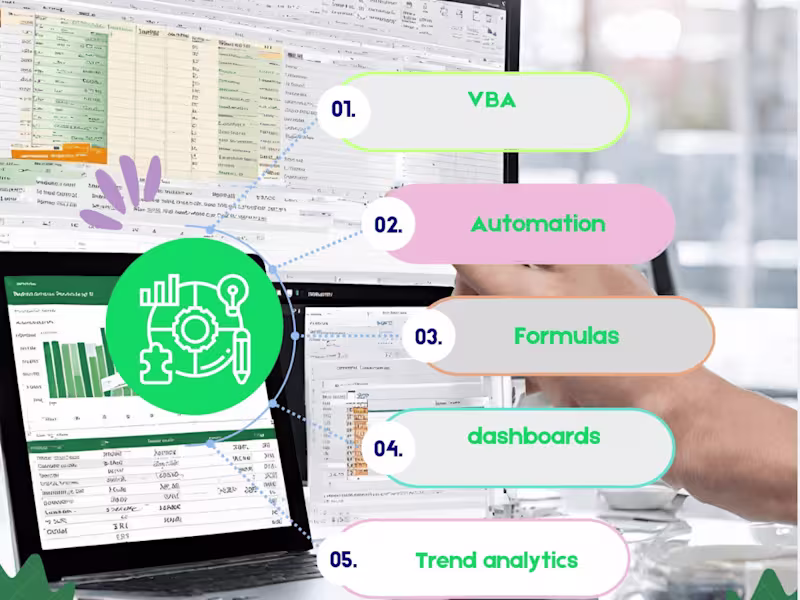
Data Analytics & Visualization Expert 🎯
Data Analytics & Visualization Expert 🎯
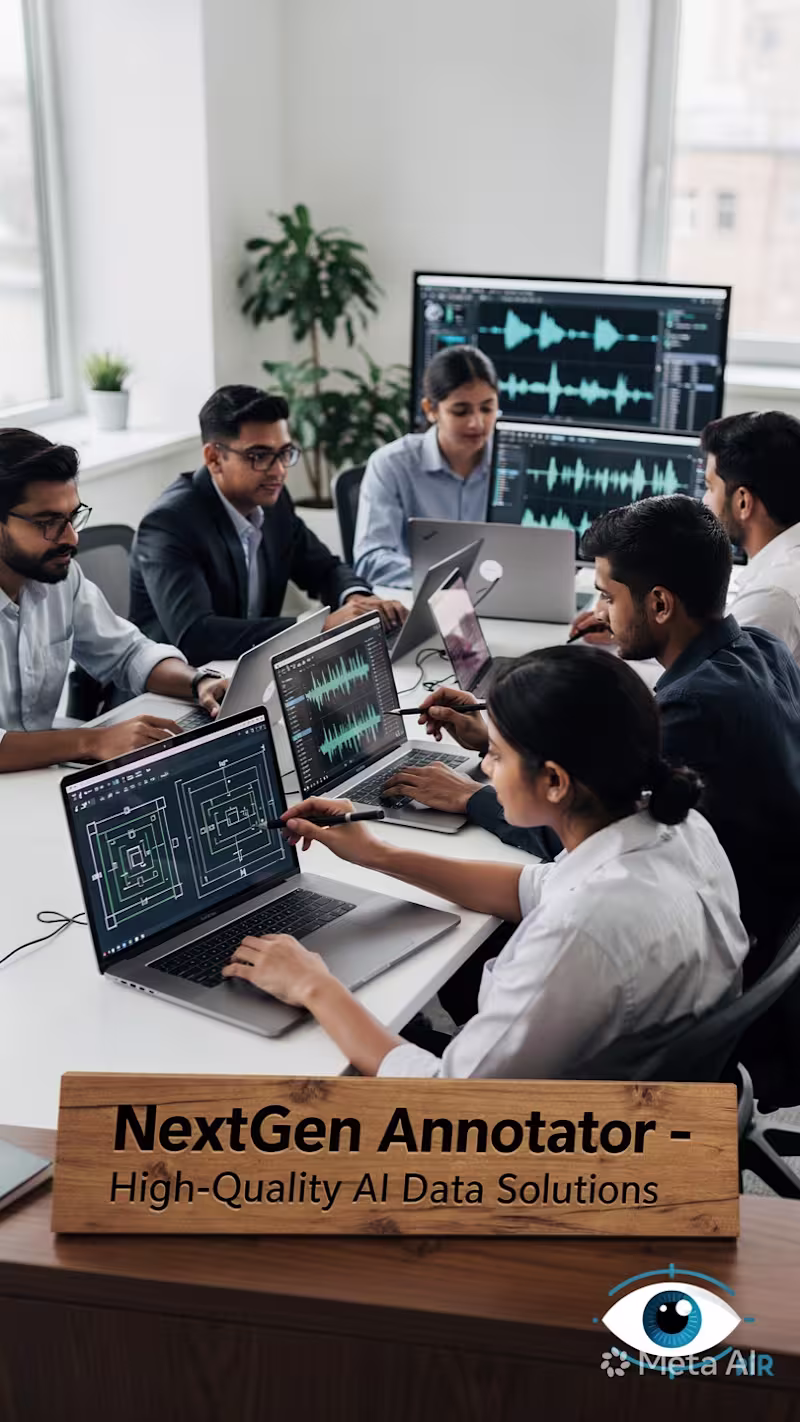
Founder at NextGen Annotator | AI Data Annotation | QA.
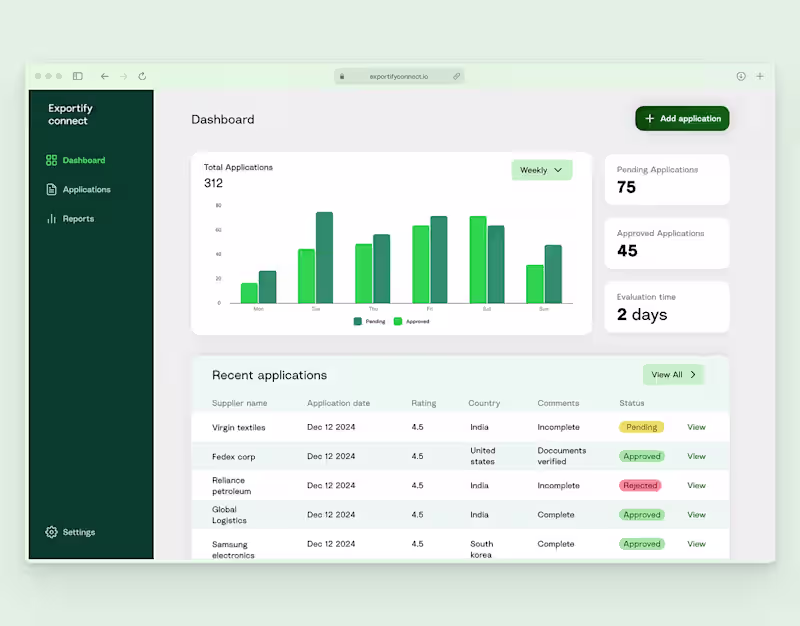
I Fix Bad UX Decisions That Silently Kill Revenue
"From Data Chaos to Business Clarity."
"From Data Chaos to Business Clarity."
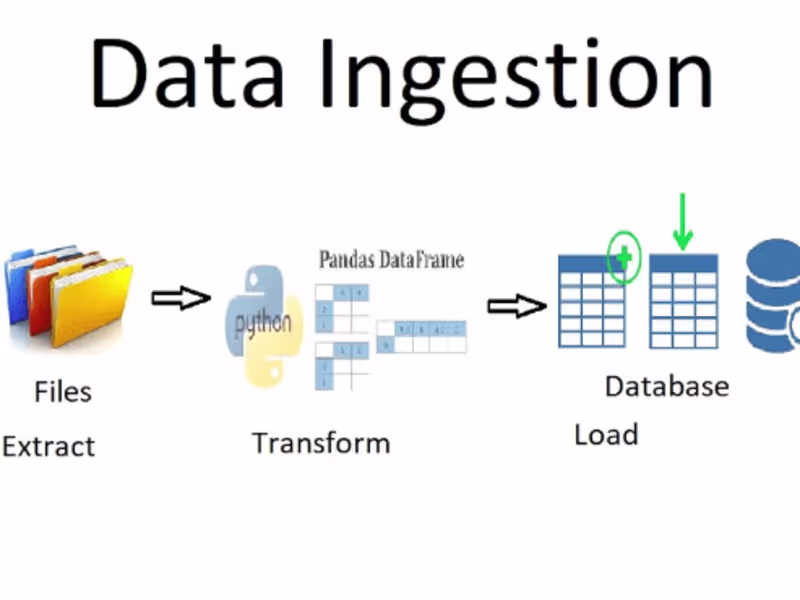
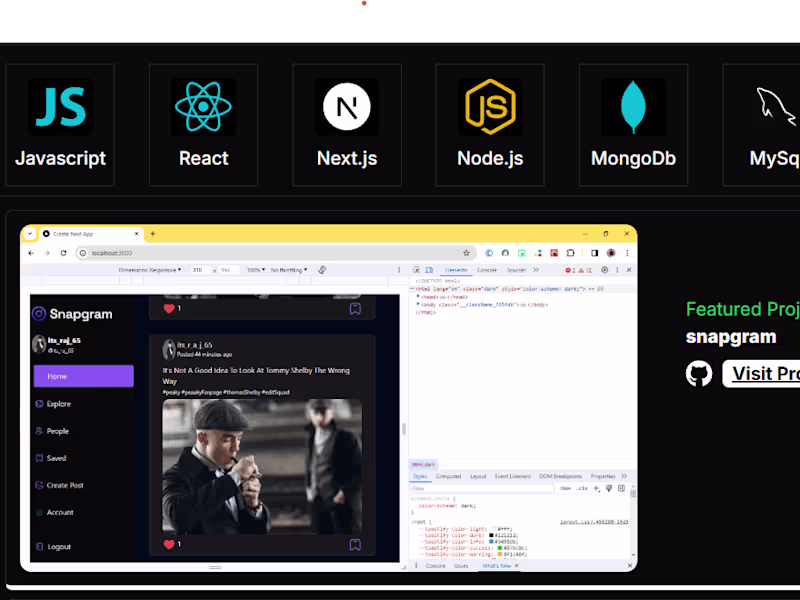
Next.js Full Stack Developer | Data Analyst
Next.js Full Stack Developer | Data Analyst

View more →