CSM Performance Dashboard using PowerBI
Bharat Sahu
Summary:
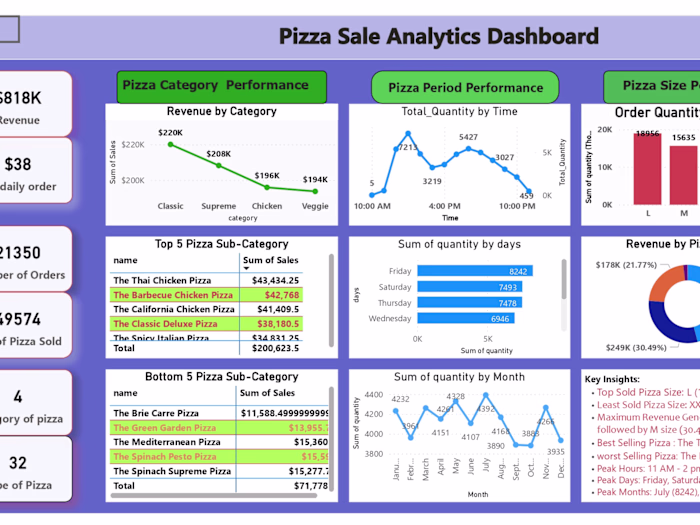
I created a comprehensive ‘CSM Performance Dashboard’ that provides real-time insights into different Revenue metrics. It tracks key performance indicators, visualizes trends, and highlights areas for improvement. This dashboard enhances decision-making, boosts CSM team efficiency, track their performance and drives overall business growth by presenting data in an intuitive and actionable format.
Scope:
The ‘Sales Performance Dashboard’ was designed to provide a holistic view of sales activities and performance metrics for the sales and CSM team. It had following features:
Real-Time Data Integration: Connects to various data sources to pull in real-time sales data.
Key Performance Indicators (KPIs): Tracks essential KPIs such as total Actual Vs Target Revenue, Revenue growth, conversion rates etc
Trend Analysis: Visualizes trends over time to identify patterns and seasonal variations.
Performance Comparison: Compares performance across different regions, products, and CSM teams.
Interactive Visualizations: Utilizes interactive charts, filters and graphs to make data exploration intuitive.
Alerts and Notifications: Sends alerts for significant changes or anomalies in sales data.
Business Problem:
The primary business problem addressed by the dashboard is the lack of visibility into CSMs performance, which can lead to:
Inefficient Decision-Making: Without real-time insights, CSM managers struggle to make informed decisions quickly.
Missed Opportunities: Inability to identify and act on actual trends and opportunities in a timely manner.
Low Team Efficiency: CSM teams may not be aware of their performance metrics, leading to suboptimal productivity.
Solution:
The ‘CSM Performance Dashboard’ solves these problems by:
Centralizing Data: Aggregates CSM data like 'Revenue', 'Bookings' from multiple sources into a single, unified dashboard.
Performance Tracking: Allows CSM managers to monitor KPIs and track progress against targets.
Trend Visualization: Helps identify trends and patterns, enabling proactive adjustments to sales strategies.
Actionable Insights: Highlights areas for improvement and suggests actionable steps to enhance sales outcomes.
Enhanced Collaboration: Facilitates better communication and collaboration among CSM teams by providing a shared view of performance metrics.
Like this project
Posted Sep 11, 2024
Bharat created an interactive sales performance dashboard using Power BI, providing real-time insights into sales metrics and trends.