Smart Data Analyst — AI-Powered Data Analysis App
Abu Aasif Ansari
Smart Data Analyst — AI-Powered Data Analysis App
The Problem :
Most business owners have data sitting in Excel or CSV files — but no easy way to make sense of it. Hiring a full-time analyst is expensive. Learning Python takes months. So the data just sits there, unused.
The Solution :
I built a tool that changes that. Upload your file — the app does the rest. No coding. No analyst needed. Just answers.
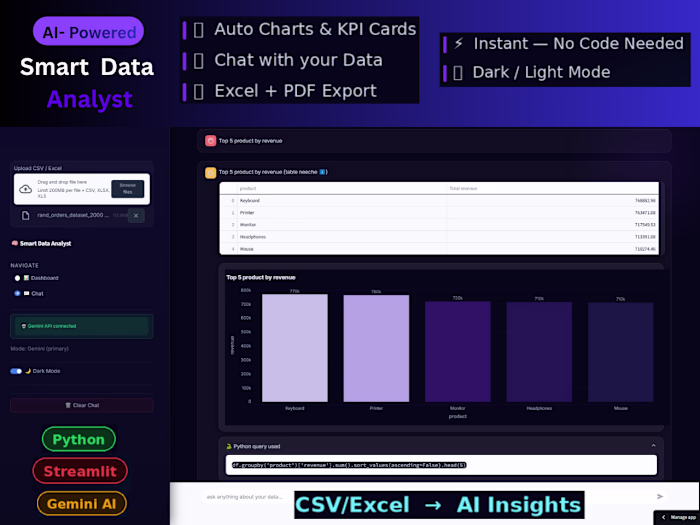
What It Does :
→ Auto-detects KPIs from any dataset
→ Generates charts automatically
→ Ask questions in plain English — get instant answers with tables and charts
→ Downloads full PDF report with KPIs and charts
→ RAG memory — remembers past questions across sessions
Tech Stack :
Python · Streamlit · Gemini API · Pandas · Plotly · fpdf2
Live Demo :
Try it yourself — upload any CSV or Excel file and see it in action.
Like this project
Posted Jun 14, 2026
Built an AI-powered app for auto-detecting KPIs and generating reports from datasets.
Likes
1
Views
4