The network for creativity
Join 1.25M professional creatives like you
Connect with clients, get discovered, and run your business 100% commission-free
Creatives on Contra have earned over $150M and we are just getting started
Back to feedPost

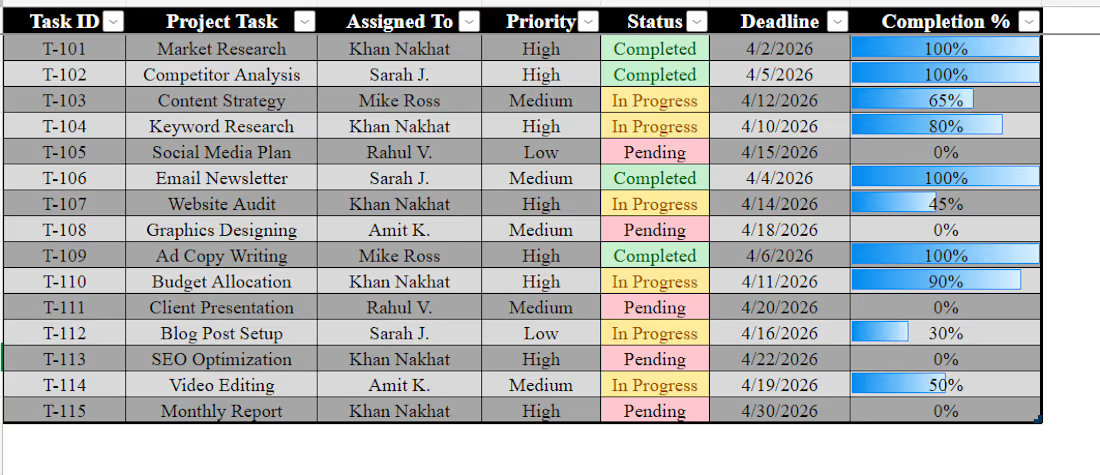
"I just finished building this Dynamic Task Tracker in Excel! 📊
To make project management easier, I’ve added:
✅ Visual Status: Green/Yellow/Red indicators for instant updates.
✅ Progress Bars: Automated bars to show task completion at a glance.
✅ Organized Workflow: Structured by priority and deadlines.
If you need help organizing your business data or creating custom Excel dashboards, I’m available for new projects! 🚀"


keep up the good work

The colour coded status indicators combined with progress bars make this really easy to scan at a glance — managers can see exactly where each task stands without reading every row. Structuring by priority and deadline is the right call too. Did you build the progress bars using conditional formatting or data bars in Excel?
The network for creativity
Join 1.25M professional creatives like you
Connect with clients, get discovered, and run your business 100% commission-free
Creatives on Contra have earned over $150M and we are just getting started




Related posts

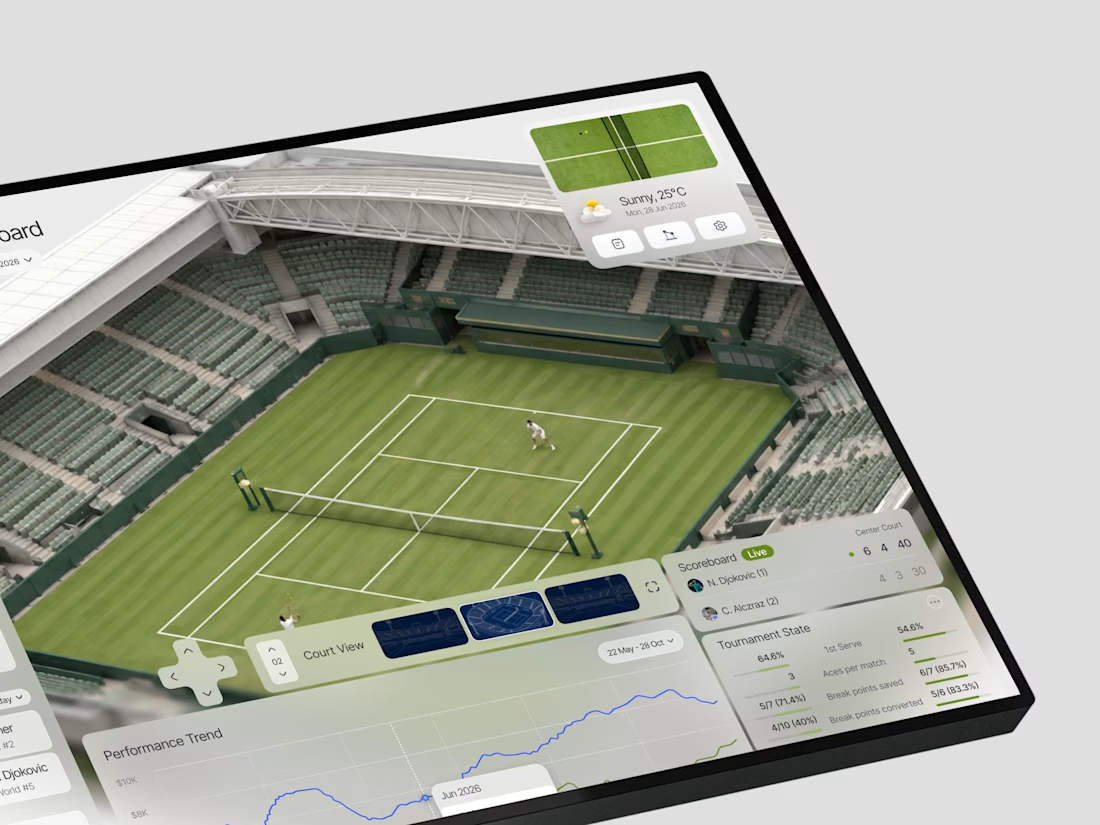
This is such a great example of turning complex data into a visual experience. 🎾🔥
Love how the court becomes part of the analytics instead of just sitting in the background. Really impressive work!

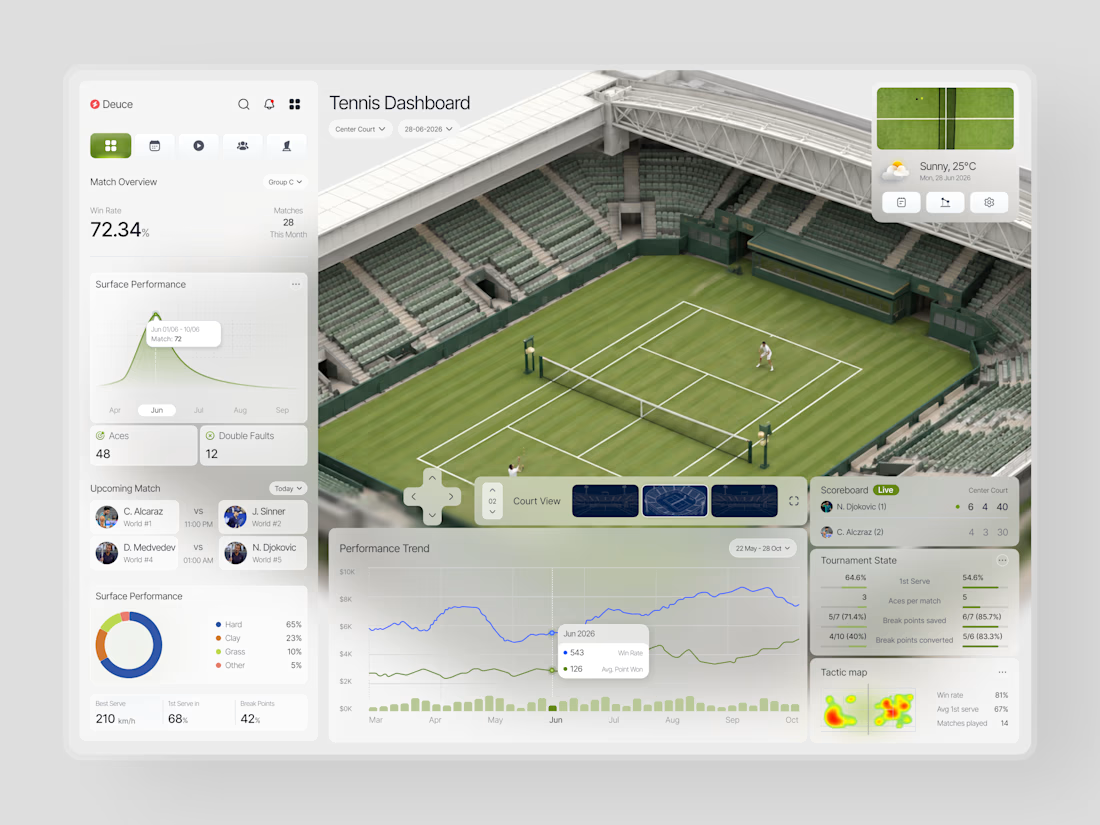
When does a sports dashboard need the court to be more than a background?
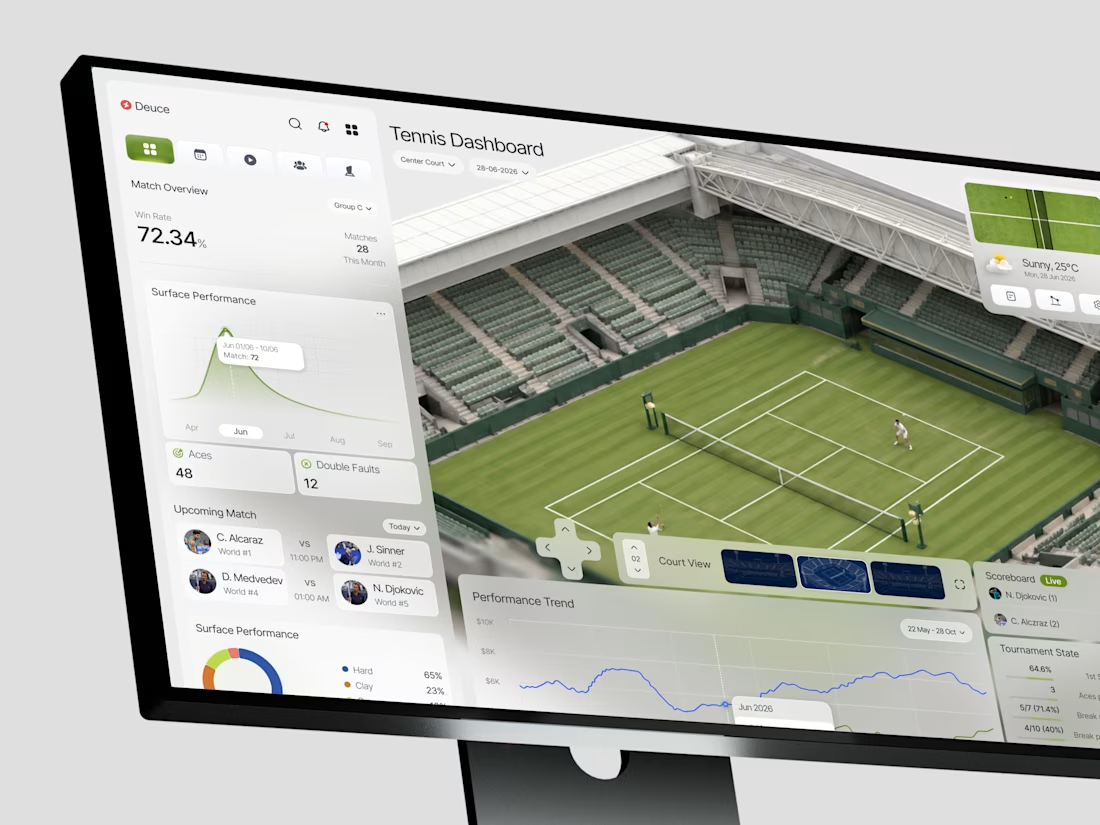
In this case, we were designing Deuce a tennis analytics platform that needed to make complex match data feel immediate and spatial, not just numerical.
The brief was clear: analysts and coaches don't just...

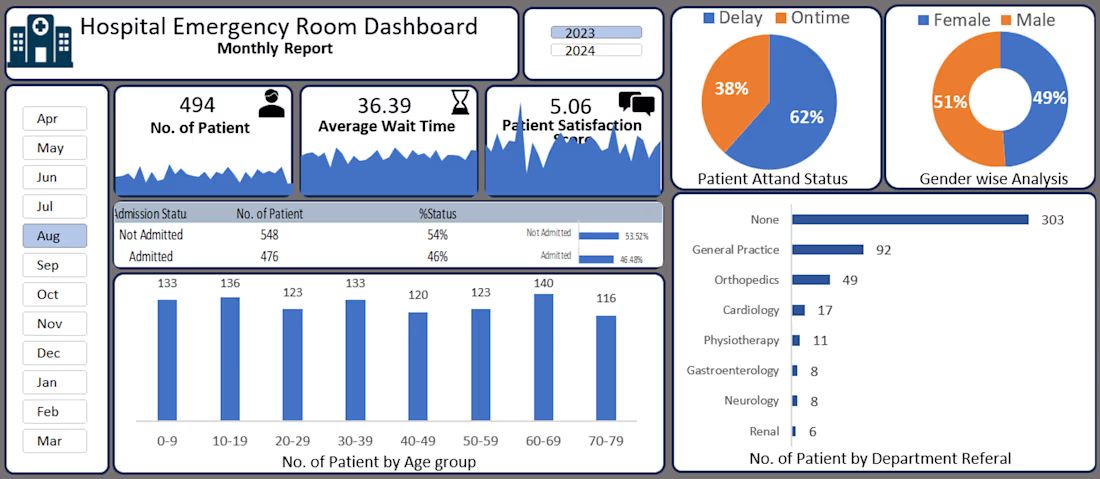
Created an interactive Hospital Emergency Room Dashboard Excel to analyze patient visits, waiting time, admission status and department performance. Used data cleaning, Pivot Tables, and visualizations to present key insights.

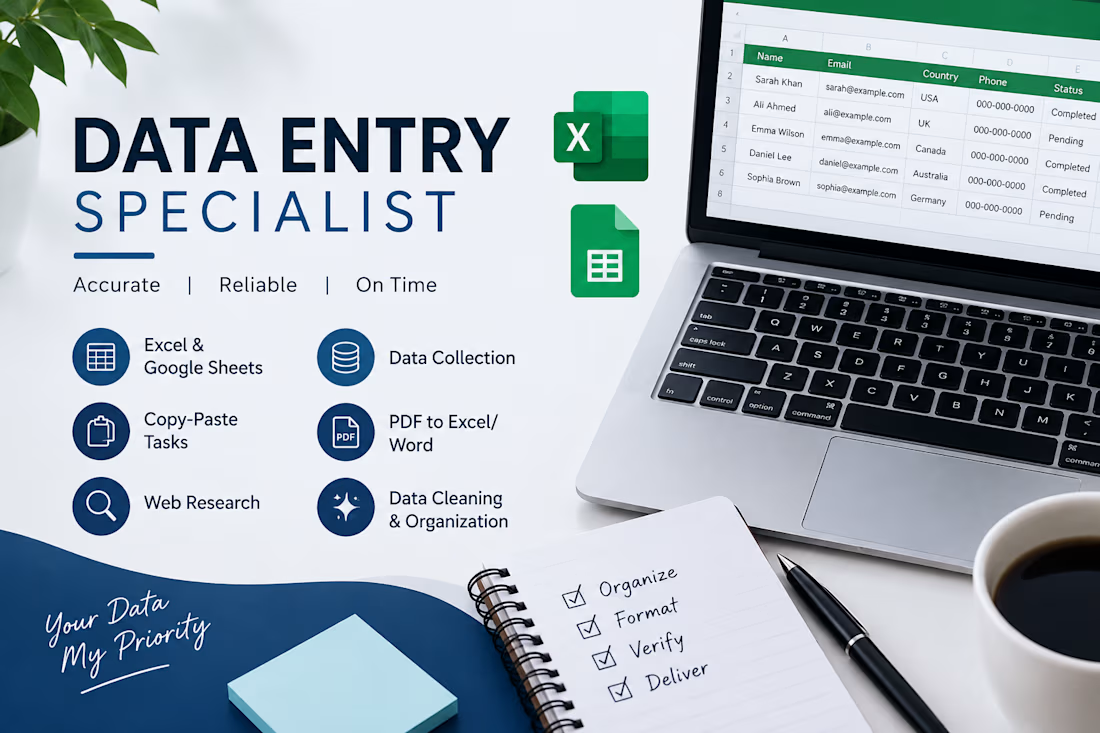
🚀 Available for Data Entry & Content Writing Projects
Hi! I’m Jaza, a Data Entry Specialist and Content Writer.
I can help with:
• Data Entry & Data Collection
• Excel & Google Sheets
• Web Research
• Copy-Paste Tasks
• PDF to Excel/Word
• Data Organization & Cleaning
• Blog & Website Content
I focus on accurate work, clear communication, and on-time delivery.
If you have a project, feel free to connect with me. 🤝