
Istiak Ahmed Khan
Power BI Data Analyst + ML AI Automation Expert
- 5.00
- Rating
- 106
- Followers
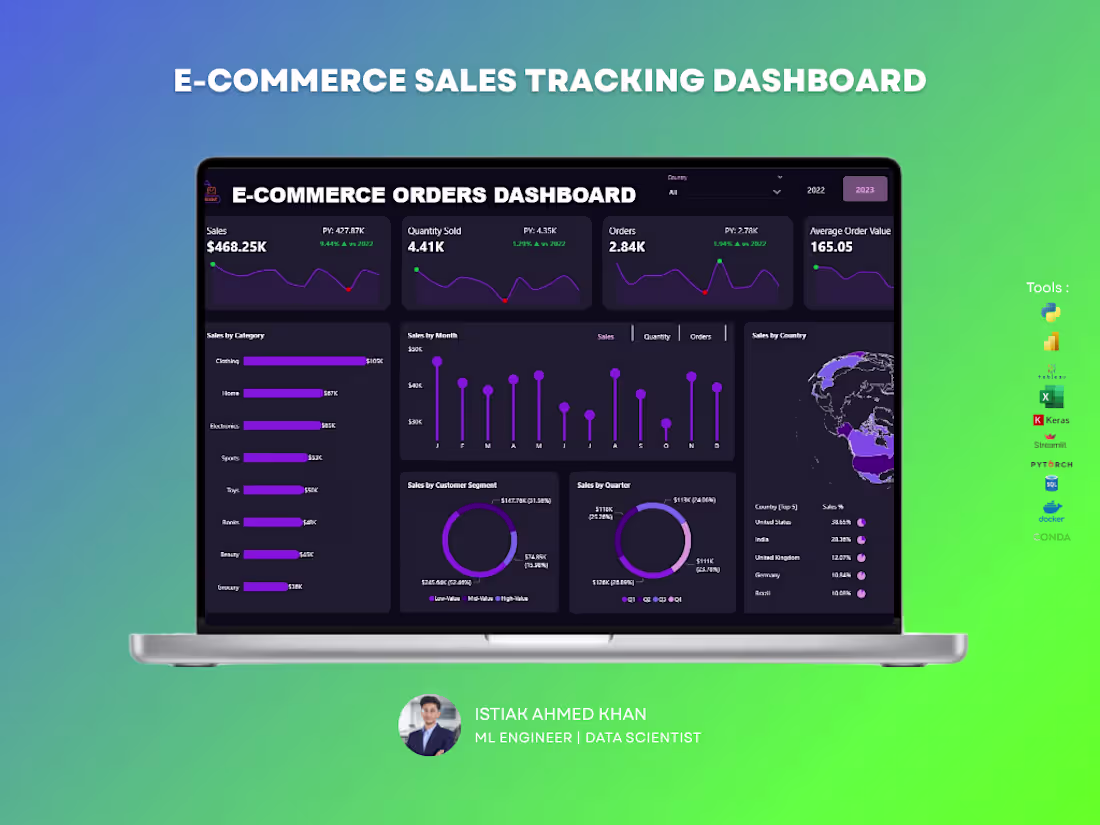
The E-Commerce Orders Dashboard provides a comprehensive overview of order performance, revenue trends, and customer purchasing behavior. Designed for online businesses, this dashboard transforms transactional order data into actionable insights that support growth, operational efficiency, and strategic decision-making.
2
11
1.3K
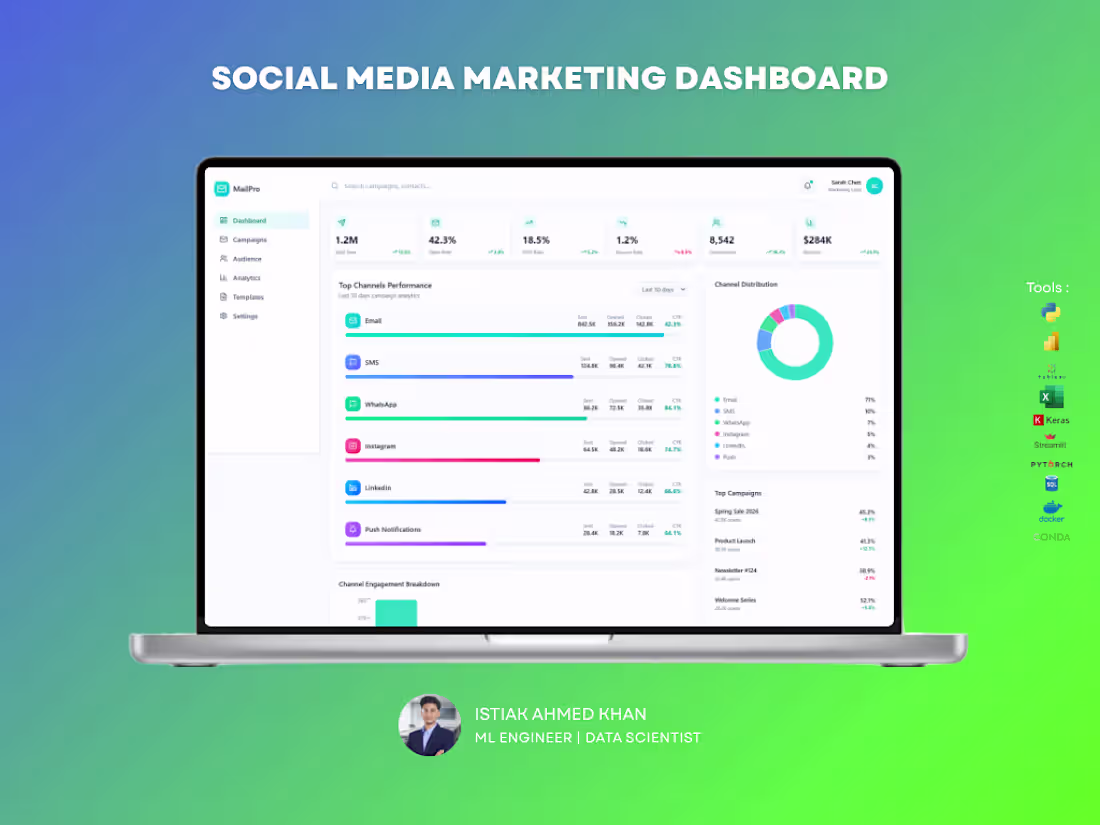
Email Marketing Analytics Dashboard – UI/UX Design
Struggling to track campaign performance across multiple channels? This dashboard is designed to give you a complete, real-time view of your marketing efforts in one clean and intuitive interface.
A powerful, easy-to-use dashboard that helps you monitor email, SMS, social media, and push campaigns without the confusion of scattered data. Every key metric is presented clearly so you can make faster, smarter decisions.
Key Capabilities:
Track open rates, click rates, conversions, and revenue in real time,
Compare performance across multiple marketing channels,
Identify your top-performing campaigns instantly,
Understand audience engagement with clear visual breakdowns,
Spot trends and optimize campaigns quickly.
Most businesses run campaigns but struggle to understand what’s actually working. This dashboard eliminates guesswork by turning your data into clear, actionable insights — helping you improve ROI and scale winning strategies.
Perfect For:
Digital marketers,
E-commerce brands,
Agencies managing multiple campaigns,
Startups looking to optimize growth.
If you want a high-converting, professional dashboard that not only looks great but drives real business decisions — I can help you build it.
8
18
941
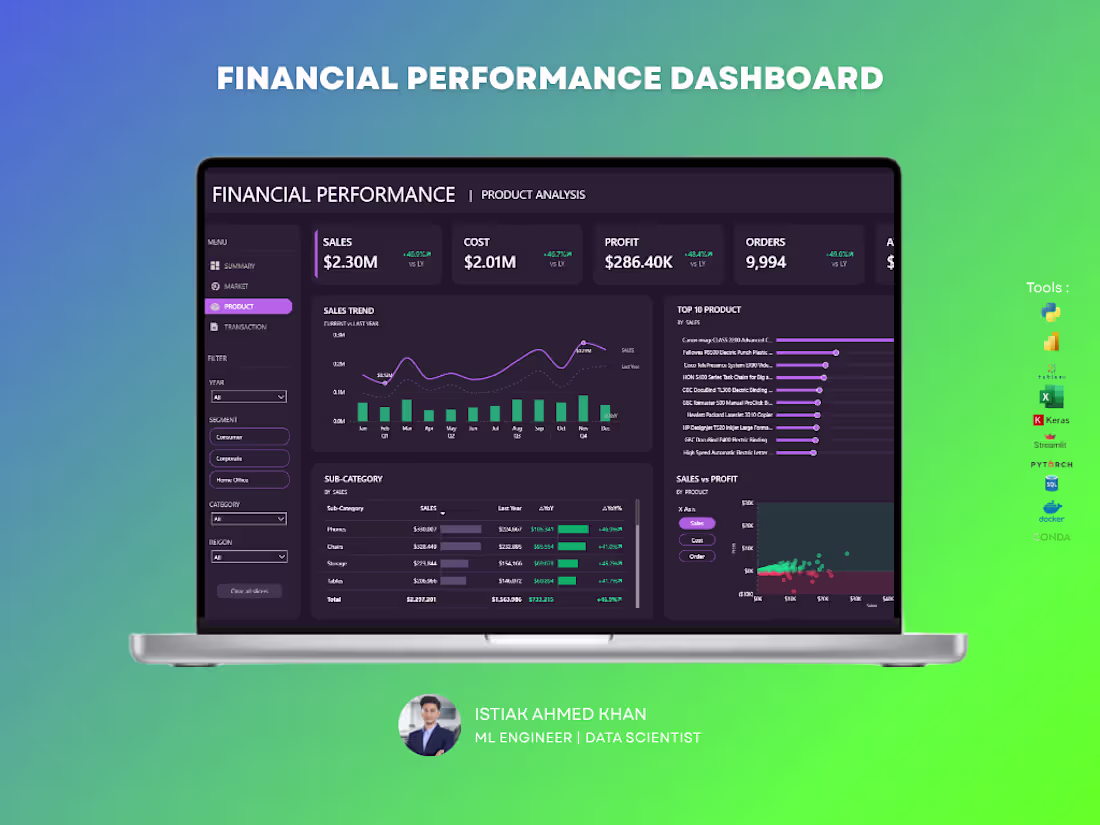
The Financial Performance Dashboard provides a comprehensive overview of an organization’s financial health by tracking revenue, expenses, profitability, and key financial indicators. Built using Power BI, this dashboard enables finance teams and decision-makers to monitor performance, identify trends, and make data-driven strategic decisions.
6
1K
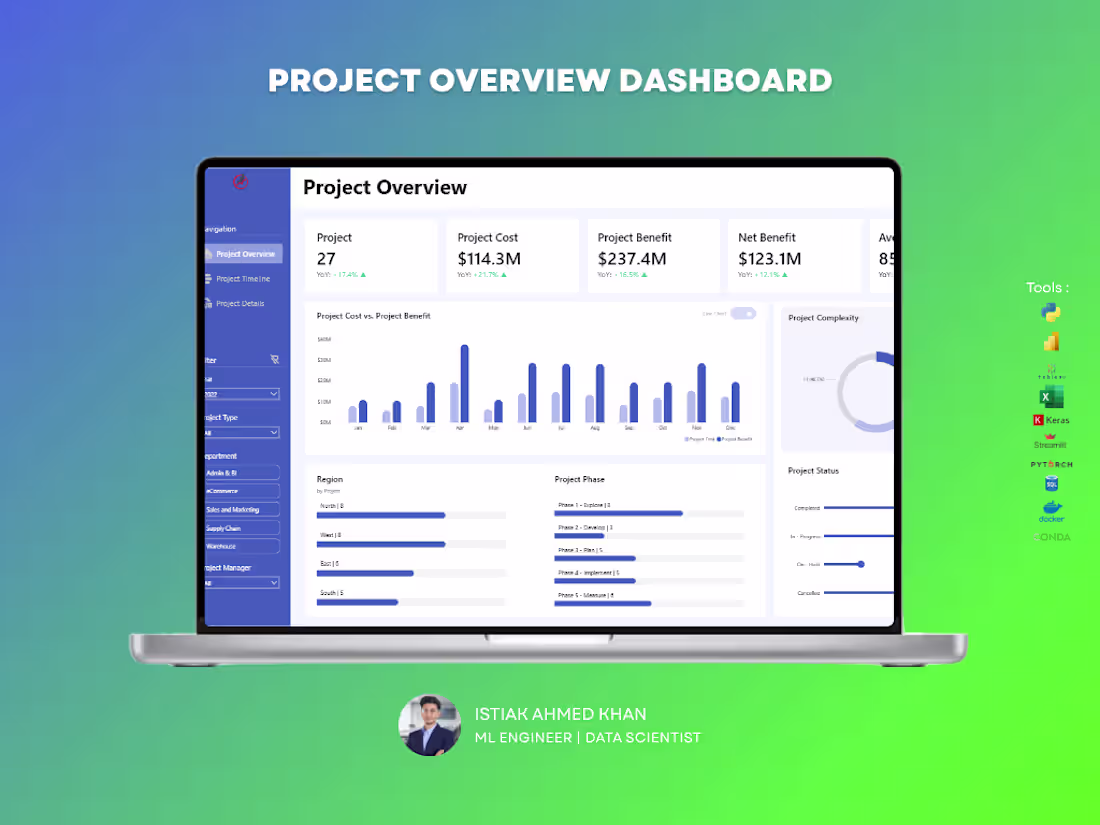
This Project Overview Dashboard provides a comprehensive view of project performance, financial outcomes, and operational progress across the organization. Built using Power BI, this dashboard enables project managers and executives to monitor key project metrics, evaluate cost efficiency, and track overall project status in real time.
Key KPIs Tracked:
✔ Total Projects – Number of active and completed projects
✔ Project Cost – Total investment allocated across projects
✔ Project Benefit – Estimated value or return generated from projects
✔ Net Benefit – Difference between project benefit and cost
✔ Average Completion Rate – Overall project progress percentage
5
13
1.4K
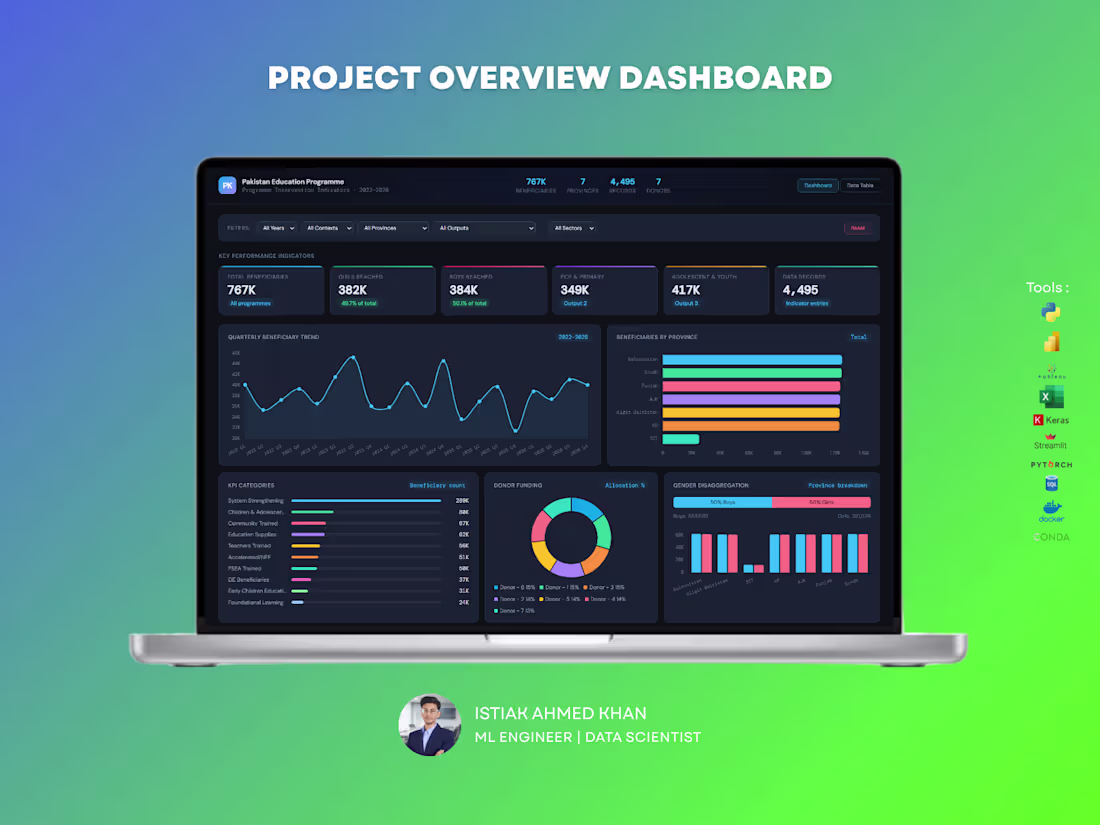
Education Program Analytics Dashboard – Data Analytics Solution
Handling large-scale program data without clear visibility can make impact measurement difficult. This dashboard is designed to give organizations a complete, real-time view of program performance, reach, and funding — all in one place.
What You Get :
A powerful, interactive dashboard that helps track beneficiaries, program outputs, regional performance, and donor contributions with clarity and precision.
Key Capabilities:
Monitor total beneficiaries and gender distribution
Track program reach across provinces and sectors
Analyze quarterly trends and growth patterns
Evaluate donor funding allocation and impact
Identify top-performing program categories and outputs
Explore education level distribution and engagement
For NGOs and large programs, data is critical for decision-making and reporting. This dashboard helps you measure impact, improve transparency, and optimize resource allocation — making your data meaningful and actionable.
Perfect For :
NGOs and non-profit organizations
Government programs
International development agencies
Research and policy teams
If you want a professional, insight-driven dashboard that clearly communicates impact and performance, I can create a customized solution tailored to your organization.
1
275
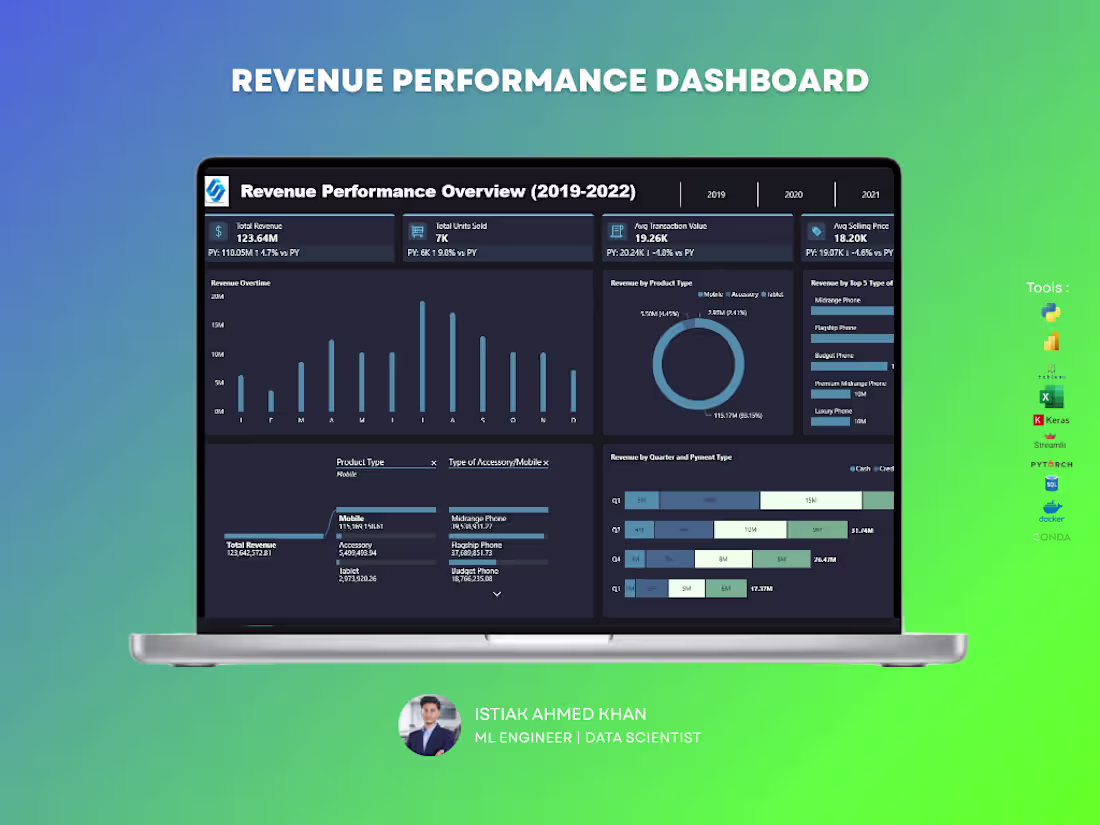
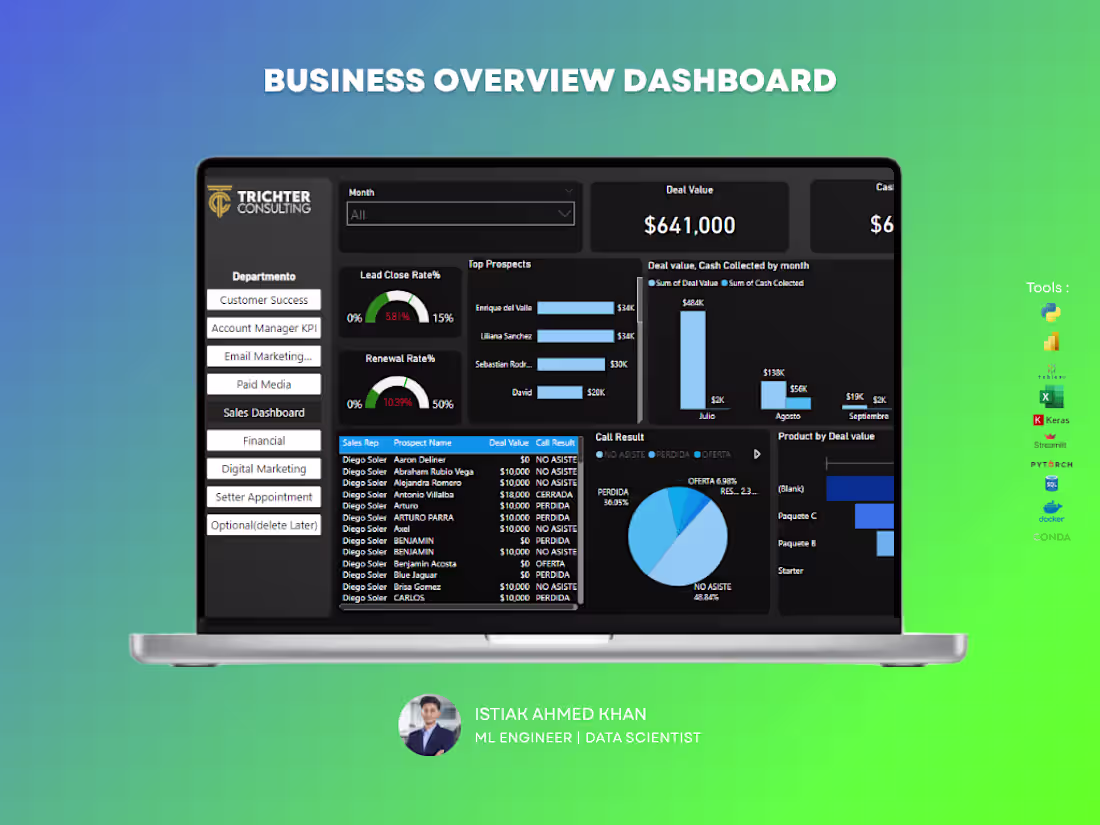
The Revenue Performance Overview provides a strategic snapshot of how revenue has evolved over time, enabling stakeholders to quickly assess business health, identify growth trends, and uncover areas requiring attention. By blending historical comparisons with real-time metrics, this section offers both context and actionable insights for data-driven decision-making.
5
989
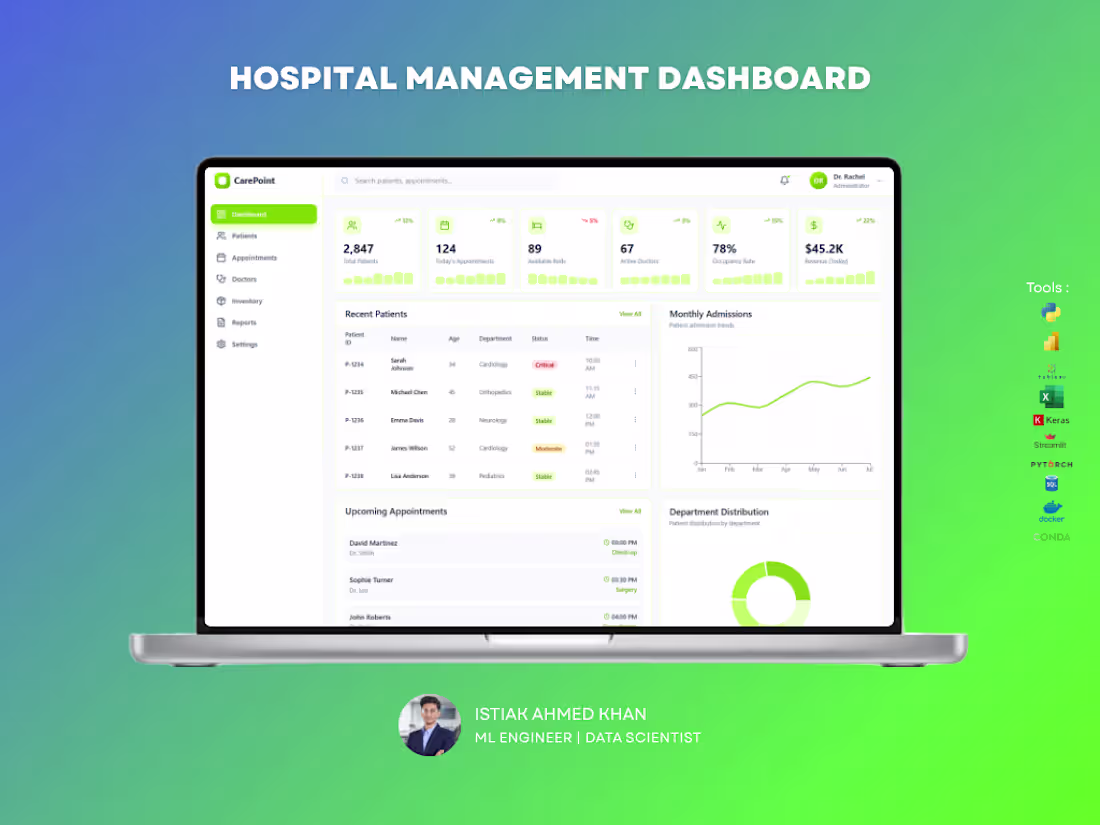
CarePoint Medical Dashboard
The CarePoint Medical Dashboard is a modern, user-friendly healthcare interface designed to streamline patient management and hospital operations. The UI focuses on clarity, accessibility, and real-time data visibility for medical professionals.
The dashboard features a clean layout with intuitive navigation, allowing users to quickly access key modules such as patients, appointments, doctors, and reports. A soft green color palette enhances readability while aligning with healthcare aesthetics.
Real-time KPI cards for patients, appointments, and revenue
Patient status tracking with visual indicators (Critical, Stable, Moderate)
Monthly admissions trend analysis
Upcoming appointments and recent patient records
Department-wise distribution insights
The interface is designed for efficiency, reducing cognitive load through organized sections and clear visual hierarchy. Interactive elements and minimalistic design ensure smooth navigation and quick decision-making.
This dashboard improves operational efficiency, enhances patient monitoring, and supports healthcare professionals in delivering timely and data-driven care.
3
11
789
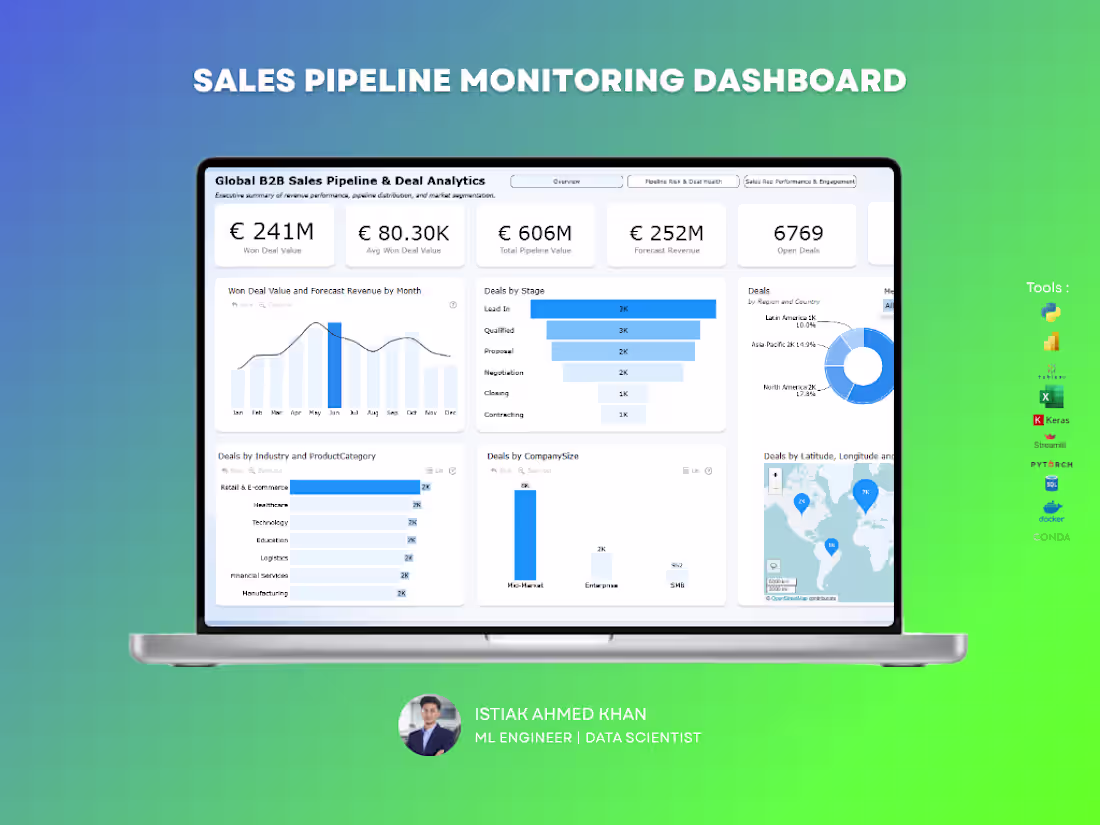
This dashboard provides a comprehensive view of global B2B sales pipeline performance, enabling organizations to monitor deal progress, evaluate pipeline risk, and forecast future revenue. Built using Power BI, the solution transforms complex sales data into actionable insights for executives, sales managers, and business strategists.
Technical Implementation:
1. Power BI dashboard development
2. Advanced DAX measures for pipeline KPIs
3. Star schema data modeling
4. Interactive filters and drill-down analysis
5. Executive-level dashboard design optimized for decision makers
2
9
1K
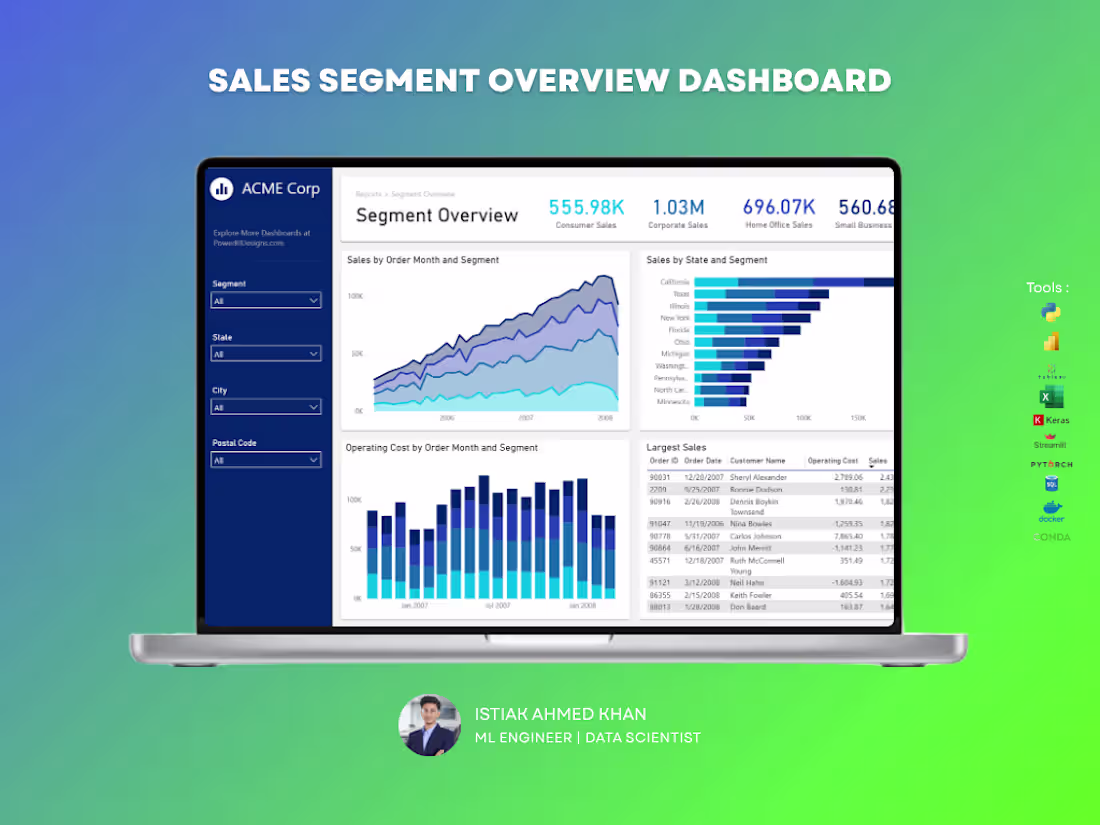
The Sales Segment Analysis Dashboard provides a detailed overview of sales performance across different customer segments, geographic regions, and time periods. Built using Power BI, this dashboard enables business leaders and sales teams to monitor revenue distribution, analyze customer segments, and identify high-performing markets.
Key KPIs Tracked:
✔ Consumer Sales – Total revenue generated from individual customers
✔ Corporate Sales – Revenue from enterprise and corporate clients
✔ Home Office Sales – Sales generated from home office customers
✔ Small Business Sales – Performance of small business customer segment
2
5
852
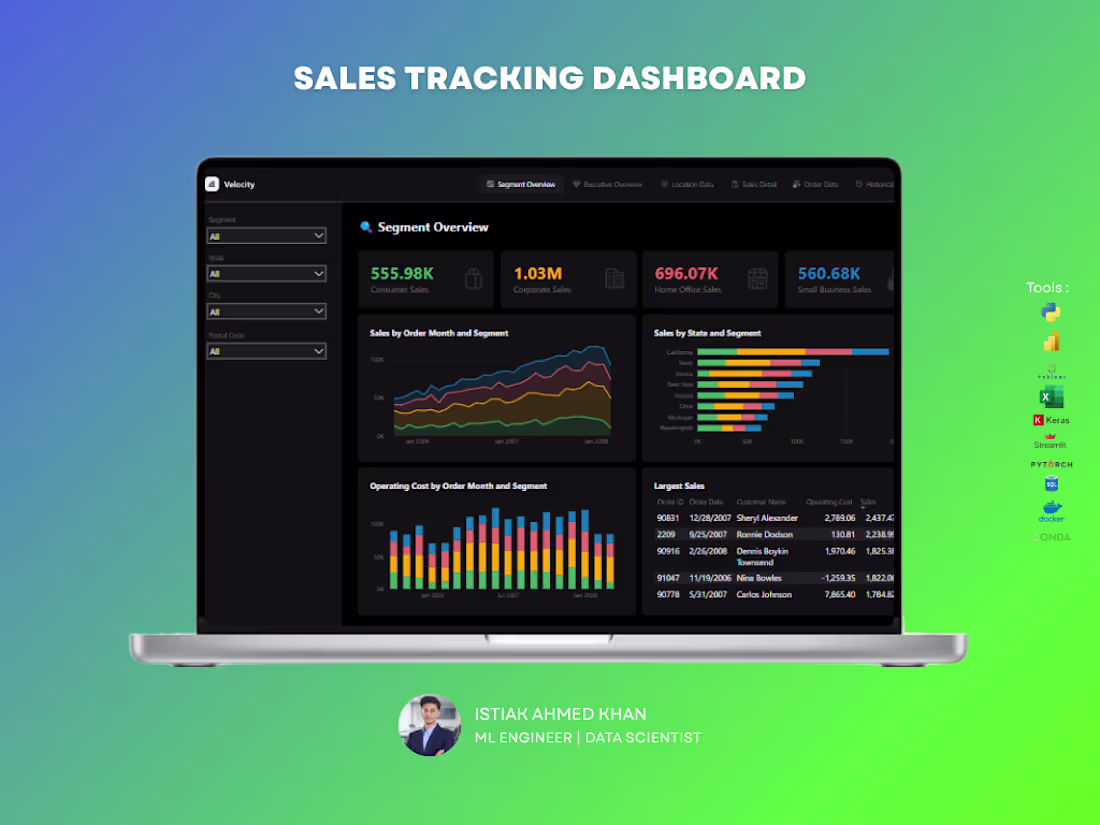
The Sales Segment Performance Dashboard provides a comprehensive view of sales distribution, operating costs, and customer segment performance across different regions. Designed using Power BI, this dashboard helps organizations analyze sales trends, identify high-performing markets, and monitor operational costs for better strategic planning.
Key KPIs Tracked
✔ Consumer Sales – Total revenue generated from individual customers
✔ Corporate Sales – Sales performance from corporate clients
✔ Home Office Sales – Revenue generated from home office segment
✔ Small Business Sales – Sales contribution from small businesses
5
8
993
This Social Media Advertisement Performance Dashboard provides a comprehensive analysis of campaign performance, revenue generation, and customer engagement metrics. Built using Power BI, the dashboard transforms raw marketing data into actionable insights for strategic decision-making.
4
832
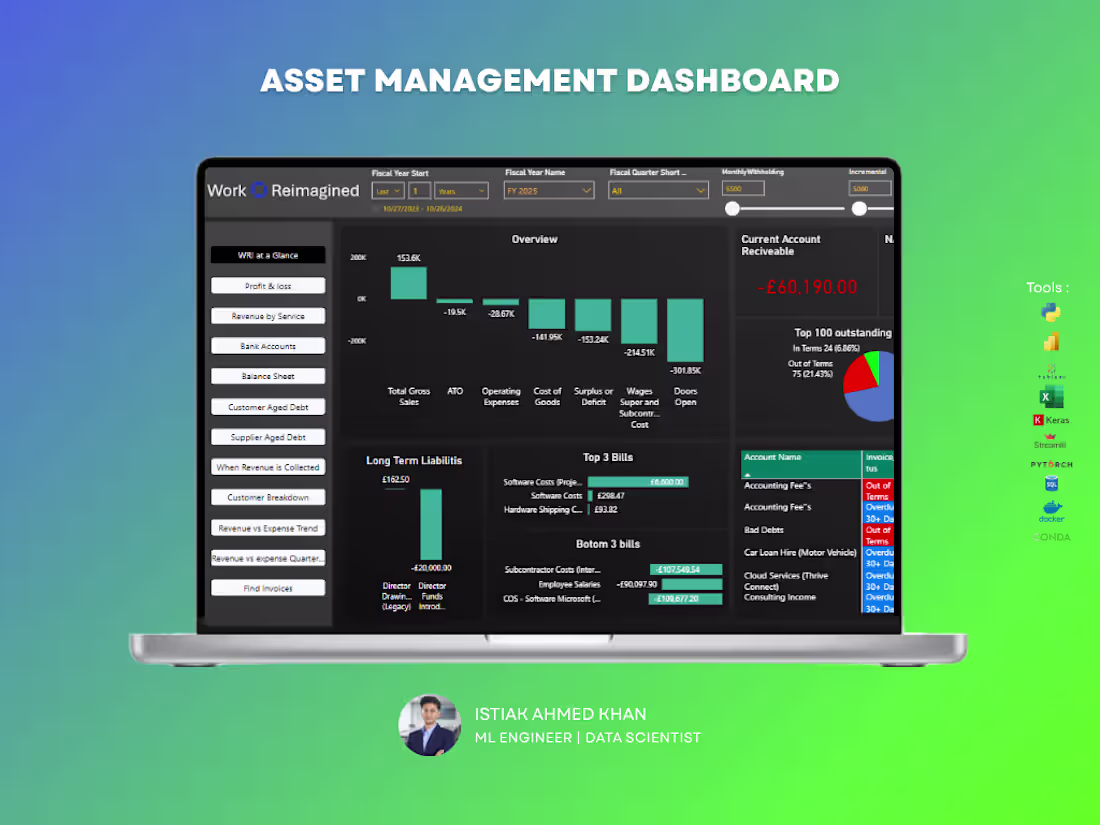
Revenue Expense Tracking
This Financial Tracking Dashboard is designed to provide a clear and structured overview of an organization’s assets, liabilities, and invoice management in one centralized system. Built using Power BI, the dashboard enables finance teams and business owners to monitor financial health, cash flow position, and outstanding invoices in real time.
2
762
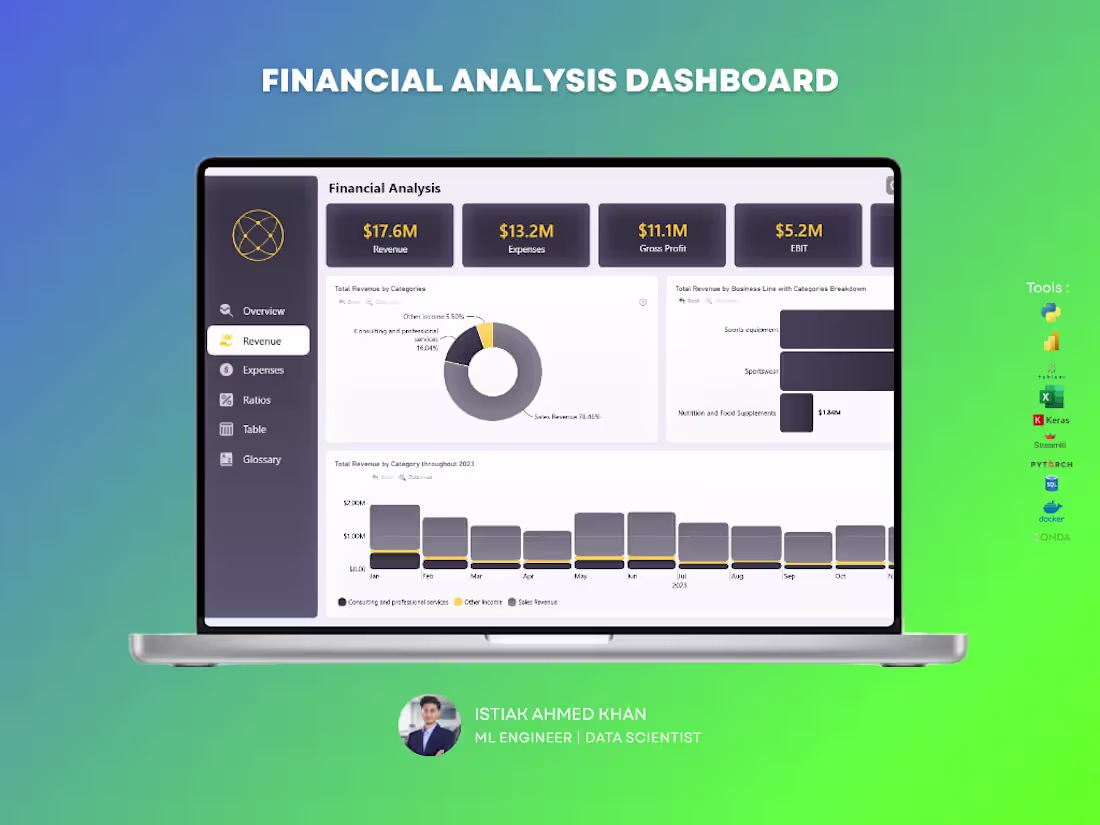
The Financial Performance Analysis Dashboard provides a comprehensive overview of an organization’s financial health by analyzing revenue, expenses, profitability, and key financial ratios. Developed using Power BI, this dashboard enables finance teams and decision-makers to monitor business performance, track profitability trends, and evaluate financial efficiency in real time.
Key KPIs Tracked
✔ Revenue – Total income generated from business operations
✔ Expenses – Combined operational and non-operational costs
✔ Gross Profit – Revenue remaining after cost of goods sold (COGS)
✔ EBIT – Earnings before interest and taxes, indicating operational profitability
✔ Net Profit – Final profit after all expenses, interest, and taxes
4
5
942
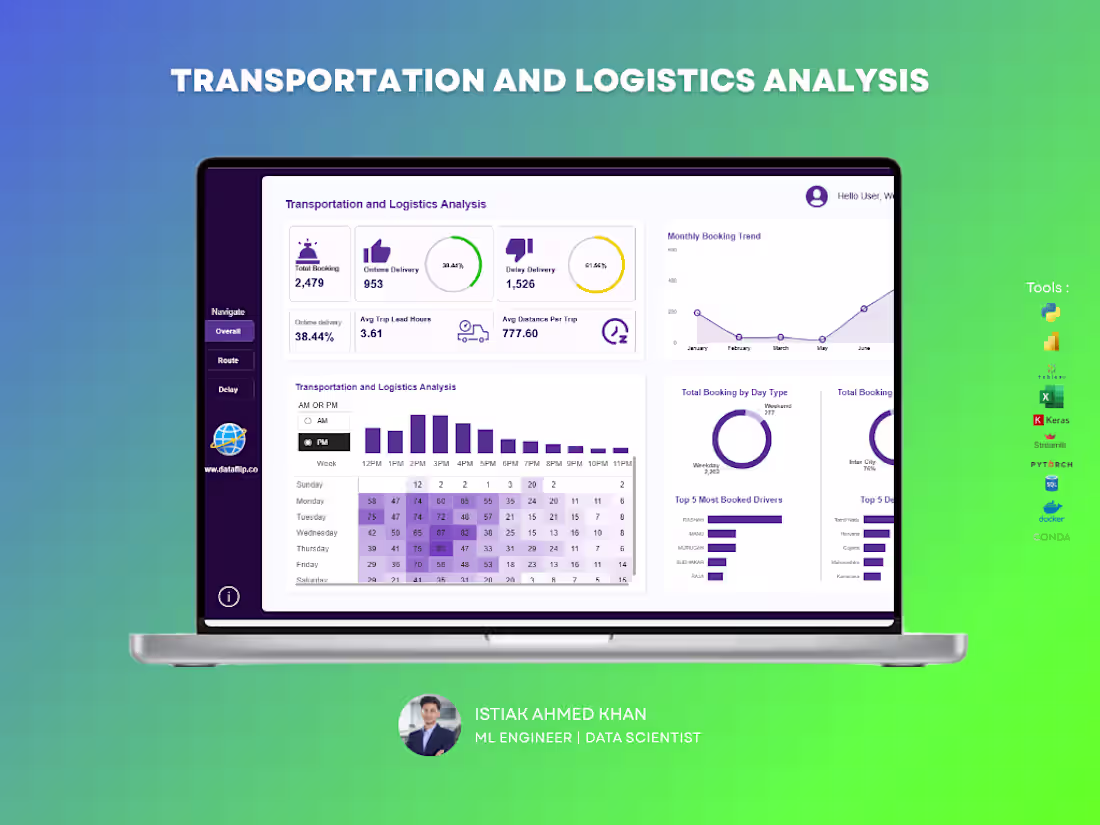
Managing logistics operations without clear insights can lead to delays, inefficiencies, and lost revenue. This dashboard is built to give you complete visibility into your transportation performance — all in one place.
A powerful analytics solution that helps you track bookings, delivery performance, delays, and operational efficiency in real time. Designed for clarity and speed, so you can make decisions without digging through raw data.
🔹Monitor on-time vs delayed deliveries instantly
🔹Track booking trends and operational workload over time
🔹Analyze trip efficiency with lead time and distance metrics
🔹Identify peak hours and demand patterns
🔹Evaluate top drivers and most frequent routes/destinations
🔹Compare weekday vs weekend performance
If you want a clean, professional dashboard that turns your logistics data into real operational insights, I can build a custom solution tailored to your business needs.
2
7
244
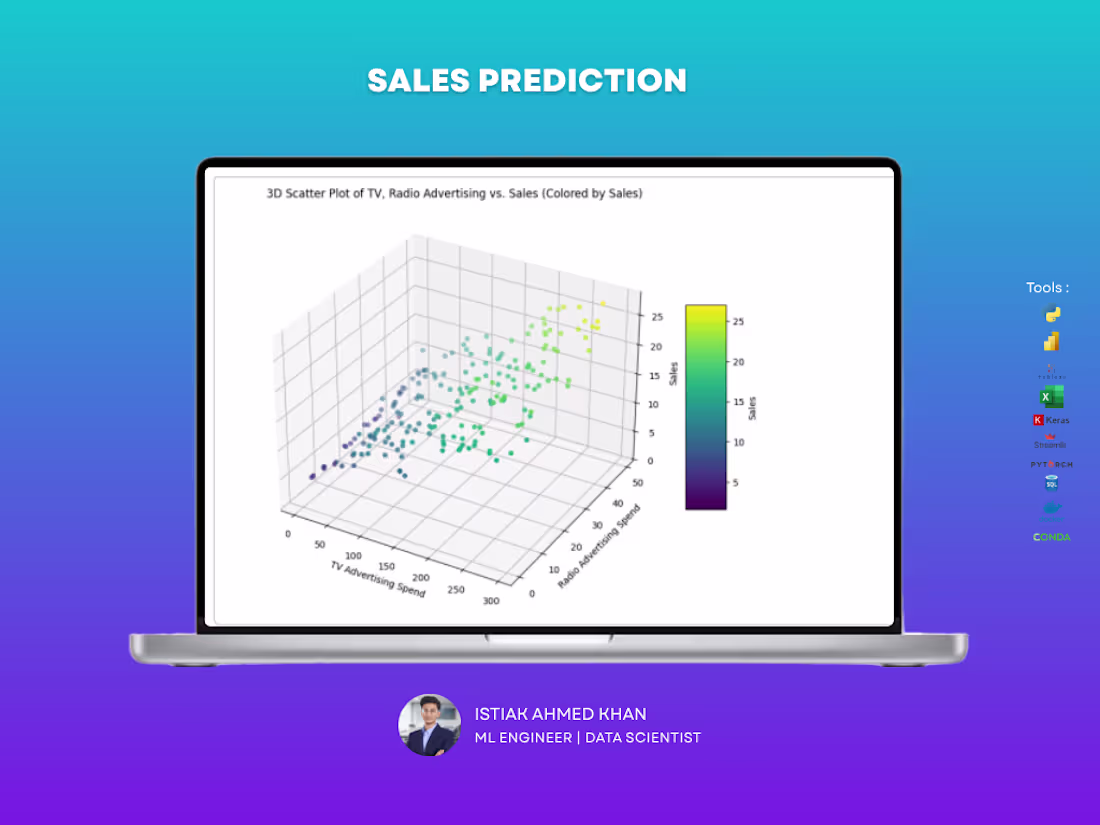
Predictive Marketing Analytics: Optimizing Advertising ROI
1. The Business Problem
Companies often struggle to determine which marketing channels actually drive revenue. Without a data-driven approach, advertising budgets are often misallocated across platforms like TV, Radio, and Newspapers, leading to inefficient spending and missed sales targets. This project aimed to build a predictive model to quantify the relationship between multi-channel marketing spend and total sales.
2. Strategic Insights & Market Analysis
Through a rigorous analysis of historical advertising data, I identified the specific drivers of revenue growth:
Dominant Revenue Driver: TV advertising emerged as the most critical factor, showing a massive 0.9 correlation with sales.
Efficiency Analysis: While Radio and Newspaper spending contributed to the marketing mix, their direct impact on sales was significantly lower (0.35 and 0.16 correlation, respectively), suggesting a need for budget reallocation.
Predictive Power: My analysis revealed that 81.6% of the variance in sales can be explained by TV advertising spend alone, providing a highly reliable foundation for future budget forecasting.
3. Data-Driven Solution
I developed a Linear Regression model to provide leadership with a mathematical framework for sales forecasting.
Reliability: The model was validated using a 70/30 train-test split, ensuring it performs accurately on new, unseen market data.
Accuracy: The system achieved a strong R-squared value of 0.79 on the test set, meaning it can accurately predict nearly 80% of sales fluctuations based on planned marketing spend.
Error Management: I performed a detailed residual analysis to confirm that the model’s error terms were normally distributed, ensuring the reliability of the forecasted figures.
4. Business Impact
Budget Optimization: Provided a clear mathematical equation (Sales=6.948+0.054×TV) that allows the marketing team to calculate the expected return on every dollar spent on TV advertising.
Strategic Planning: Enabled the transition from "gut-feeling" marketing to precision budgeting, allowing the company to maximize ROI by prioritizing high-impact channels.
Risk Mitigation: By identifying the variance that the model couldn't explain, I helped the business identify where external market factors might still influence sales, allowing for more conservative and realistic financial planning.
Technical Stack
Modeling: Simple Linear Regression, Statsmodels (OLS), Scikit-learn.
Analytics: Python, Pandas, NumPy.
Visualization: Seaborn, Matplotlib, 3D Scatter Plots
4
5
691
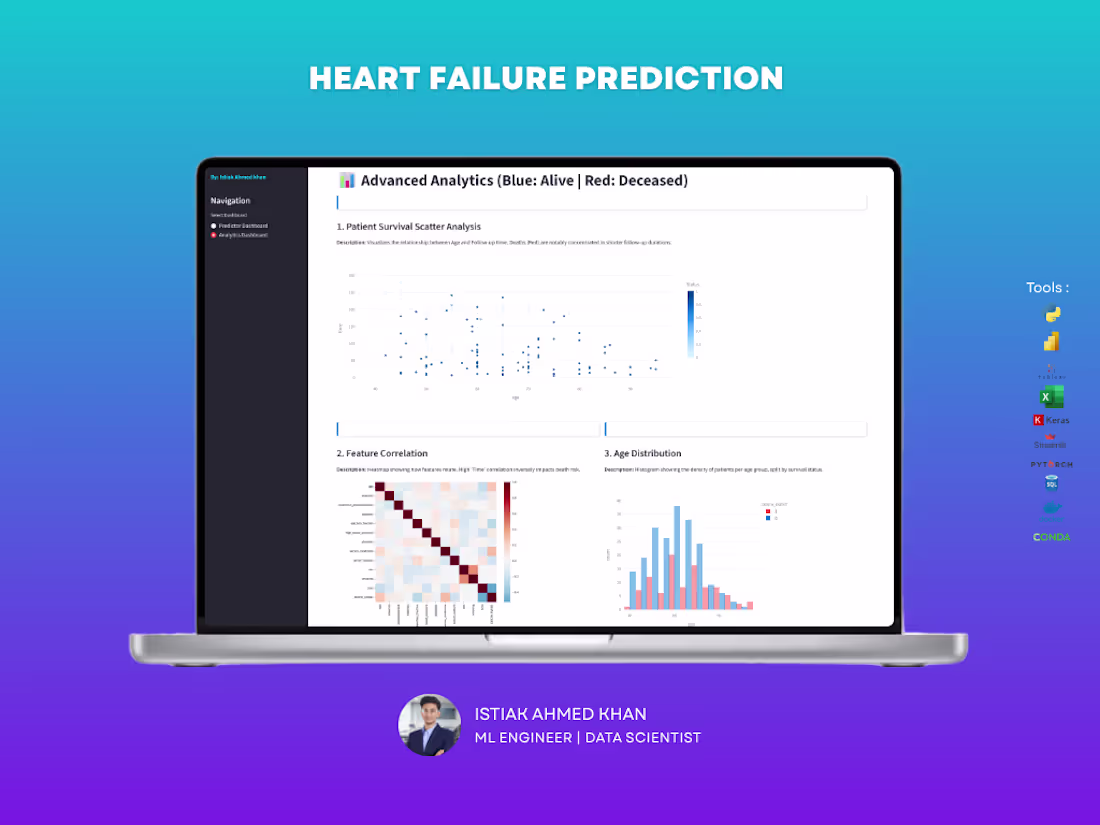
Saving Lives through Early Clinical Risk Detection
Application is live at: https://495a-35-237-151-197.ngrok-free.app
The Problem: Heart failure is a leading cause of global mortality; the difference between survival and fatality often depends on how early a high-risk patient is identified. The Solution: I developed a clinical diagnostic tool that analyzes patient health markers to forecast mortality risk, assisting medical professionals in prioritizing life-saving care. Key Impacts:
Early Intervention: The model identified that follow-up time is the single most critical factor in reducing fatalities, emphasizing the need for early diagnosis and consistent monitoring.
Precision Diagnostics: By analyzing heart efficiency (ejection fraction) and chemical markers like serum creatinine, the tool provides a high-accuracy (84.49%) risk score for every patient.
Clinical Support: The system helps doctors look past "statistical flukes" by accounting for outliers in medical data, ensuring that extreme clinical cases are caught rather than ignored.
Actionable Health Insights: Demonstrated a clear link between age, heart efficiency, and chemical abundance, giving providers a data-driven framework to improve long-term patient outcomes
1
3
692
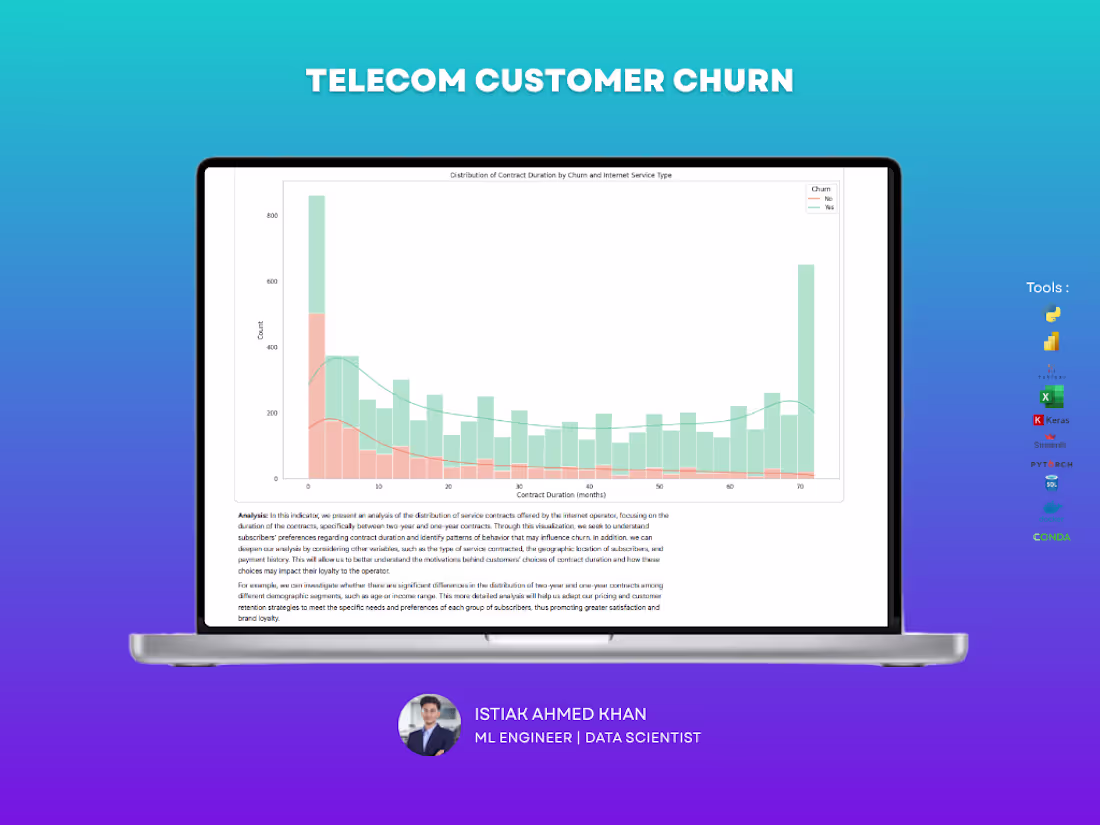
End-to-End Machine Learning Pipeline for Telecom Customer Churn
1. The Business Problem
Customer churn is a major challenge for telecommunications companies, driven by competition, service issues, and changing consumer preferences. This project was designed to transition the company from reactive support to proactive retention using data-driven strategies such as customer segmentation, personalized offers, and loyalty programs,.
2. Data Exploration & Insights (EDA)
I performed a comprehensive descriptive analysis on a database of 7,043 customers with 21 distinct variables,. Key findings included:
Contractual Risk: Customers on month-to-month contracts showed significantly higher churn compared to those on one- or two-year commitments,.
Service Preference: While Fiber Optic plans were the most popular, they also represented a critical segment for monitoring due to their higher price points,.
Financial Indicators: Churned customers had a higher average monthly charge of $74.44, compared to $61.27 for retained customers.
Payment Behavior: The "Electronic Check" payment method was most strongly associated with service cancellation,.
3. Engineering & Preprocessing Pipeline
To prepare the data for high-performance modeling, I implemented a rigorous preprocessing workflow:
Data Cleaning: Removed irrelevant identifiers like customerID and addressed potential data quality issues. The dataset was verified to have zero missing or NaN values,.
Feature Engineering: Applied Label Encoding to transform categorical text variables into a numerical format suitable for machine learning algorithms,.
Data Splitting: Adopted a standard 80/20 train-test split to ensure the model could generalize effectively to unseen data,.
4. Model Development & Benchmarking
I developed and benchmarked eight distinct machine learning algorithms to identify the most effective solution for this specific application:
Linear & Probabilistic: Logistic Regression, Naive Bayes.
Tree-Based: Decision Tree, Random Forest.
Boosting Frameworks: AdaBoost, Gradient Boosting, XGBoost, and LightGBM,.
5. Performance Evaluation & Results
Models were evaluated using ROC curves, confusion matrices, and detailed classification reports,.
Winner: Logistic Regression achieved the highest accuracy at 81.83%,.
Secondary Performers: Gradient Boosting (81.05%) and AdaBoost (80.98%) also showed strong predictive power.
6. Technical Conclusion
This data-driven approach proves that proactive churn prediction is essential for business sustainability. By identifying that customers prioritize high-speed fiber optic services but are sensitive to pricing and contract terms, the company can now optimize its pricing and retention strategies to maximize user satisfaction and revenue.
4
712
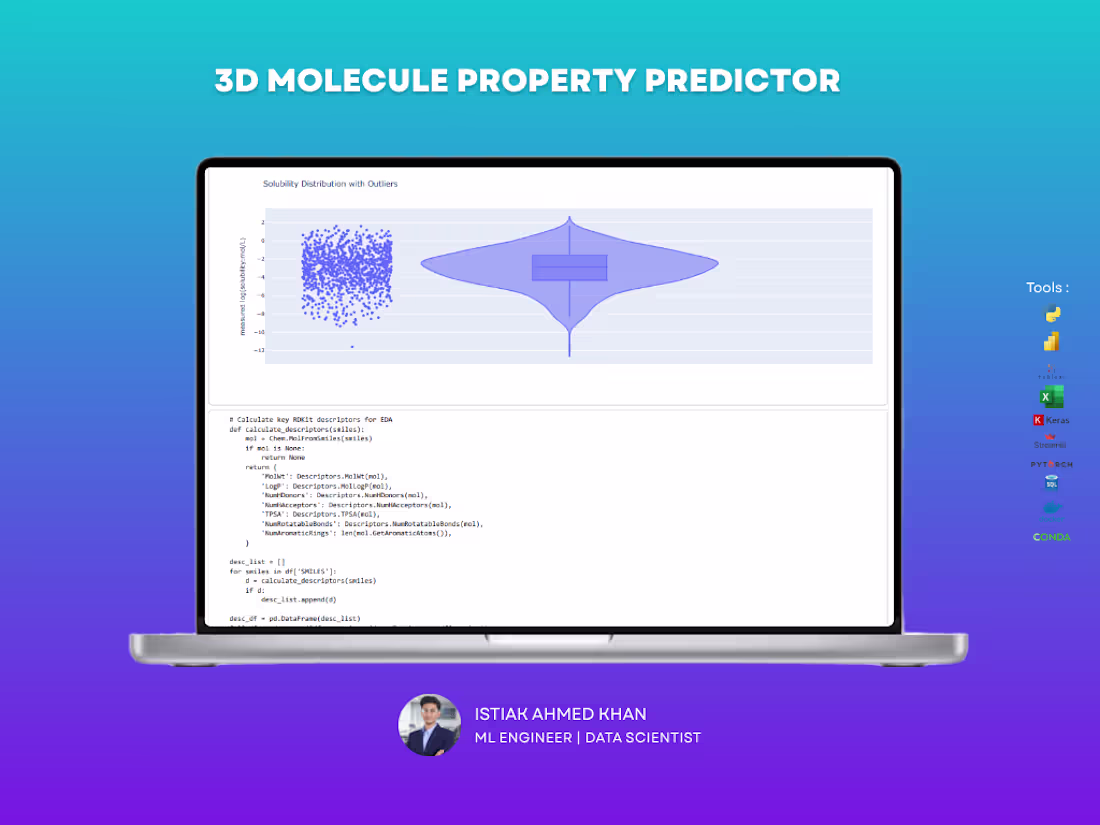
3D Molecular Intelligence: Accelerating Drug Discovery through Predictive Analytics
The Impact: This project addresses a critical bottleneck in pharmaceutical research: determining molecular solubility (logS). By replacing slow, expensive lab tests with high-precision machine learning, this system enables scientists to screen thousands of compounds in seconds, significantly reducing the cost and time required to bring new life-saving drugs to market.
Drastic Cost Reduction: The predictive pipeline reduces early-stage experimental screening costs by 70–90%, allowing research teams to focus resources on the most promising drug candidates.
High-Precision Forecasting: Utilizing a hybrid 3D feature engineering approach, the system achieves a remarkable 91.3% accuracy (R² score) in predicting solubility, providing a highly reliable alternative to physical testing.
Accelerated R&D Cycles: By automating the identification of viable molecules, the tool dramatically shortens the "hit-to-lead" time in pharma and materials science, getting products to market faster.
Empowering Researchers: I deployed a professional Streamlit dashboard featuring an interactive 3D molecular viewer. This allows non-technical chemists to visualize complex structures and make data-driven decisions without needing to write a single line of code
3
289
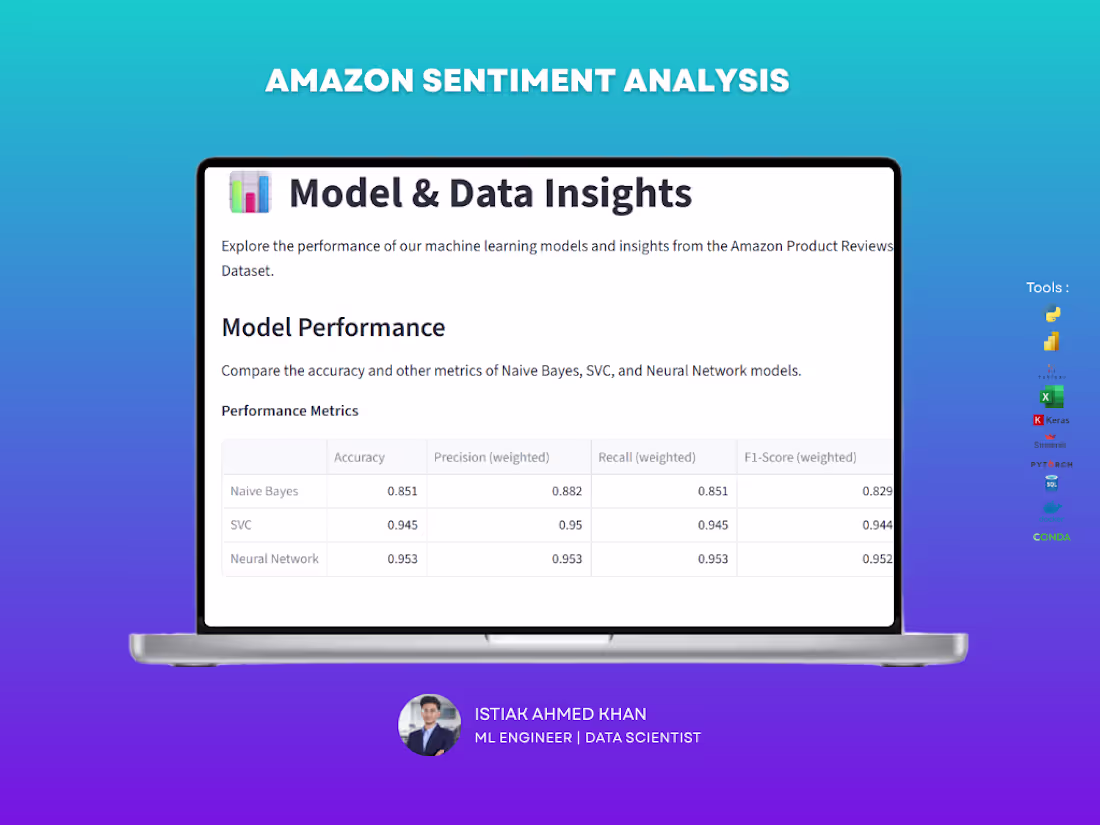
Sentiment-Driven E-commerce Optimization: Amazon Review Analysis & Rating Prediction.
Project Overview ✅
This project serves as a machine learning proof of concept designed to transform raw Amazon product reviews into actionable business insights. By automating the prediction of review ratings and analyzing customer sentiment, the system enables brands to optimize product listings, proactively address customer pain points, and drive higher conversion rates.
Process ✅
I developed an end-to-end pipeline covering data acquisition, complex text processing, and model deployment. Automated Data Scraping, Integrated the Apify API to extract real-time customer feedback directly from Amazon product URLs. I configured the scraper to handle up to 100 reviews per run, capturing critical metadata including rating scores, review descriptions, and verified purchase status.
Data Refinement & Feature Engineering:
Cleaned a dataset of approximately 1,944 reviews by removing noise (punctuation/symbols) and stop words using NLTK. I implemented TF-IDF Vectorization to convert text into numerical features and applied SMOTE (Synthetic Minority Over-sampling Technique) to address class imbalance, ensuring the model could accurately predict rare negative reviews.
Model Benchmarking ✅
Developed and compared three distinct architectures to identify the most robust predictor:
Naive Bayes: High-speed probabilistic classification.
Support Vector Classifier (SVC): Optimized for high-dimensional text data.
Neural Network (MLPClassifier): To capture complex semantic patterns.
Web App Deployment: Built a dedicated Streamlit dashboard that allows non-technical stakeholders to input raw review text and receive instant rating predictions with confidence scores.
Technical Stack✅
Languages & Tools: Python, Apify Client.
ML & NLP Libraries: Scikit-learn (SVC, Naive Bayes, MLP), NLTK (Tokenization, Stopwords), Imbalanced-learn (SMOTE).
Deployment: Streamlit, Joblib (Model Serialization).
Visualization: Plotly, WordCloud, Matplotlib.
Key Results ✅
Achieved a peak accuracy of 95.27% using the Neural Network model, with the SVC model following closely at 94.46%.
Developed sentiment-based feedback loops within the app: high ratings (4-5 stars) trigger positive marketing recommendations, while low ratings (1-2 stars) alert teams to address product issues like battery life or build quality.
Enabled real-time competitive analysis by providing a user-friendly interface for cross-functional marketing and product development teams to audit customer sentiment at scale.
2
5
728
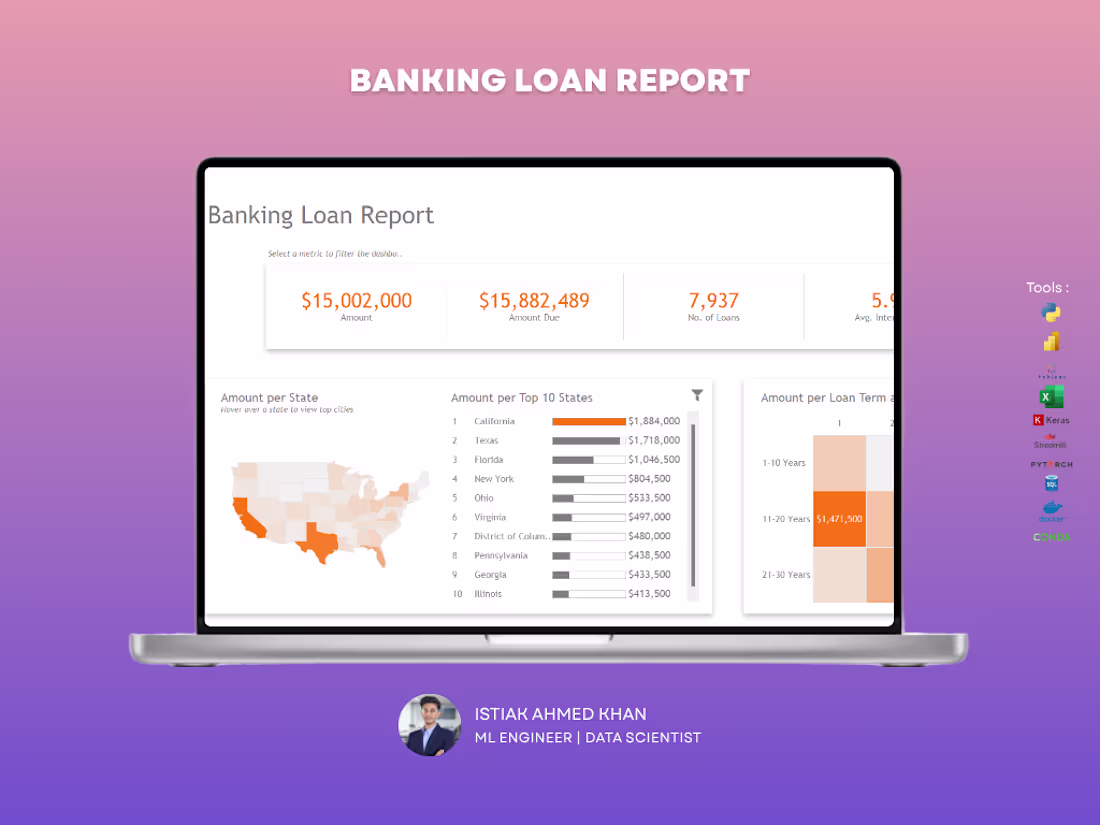
The Banking Loan Performance Report provides a comprehensive analysis of loan distribution, risk levels, and repayment status across different regions and loan terms. Built using Tableau, this dashboard helps financial institutions monitor lending performance, evaluate credit risk, and track outstanding balances efficiently.
Key KPIs Tracked:
✔ Total Loan Amount – Overall value of loans issued by the institution
✔ Total Loans – Number of loans approved and disbursed
✔ Average Interest Rate – Average interest applied across all loans
✔ Total Due Amount – Outstanding loan balance pending repayment
Check it out (https://contra.com/p/WmYQ3ABX-tableau-banking-loan-report)
5
673
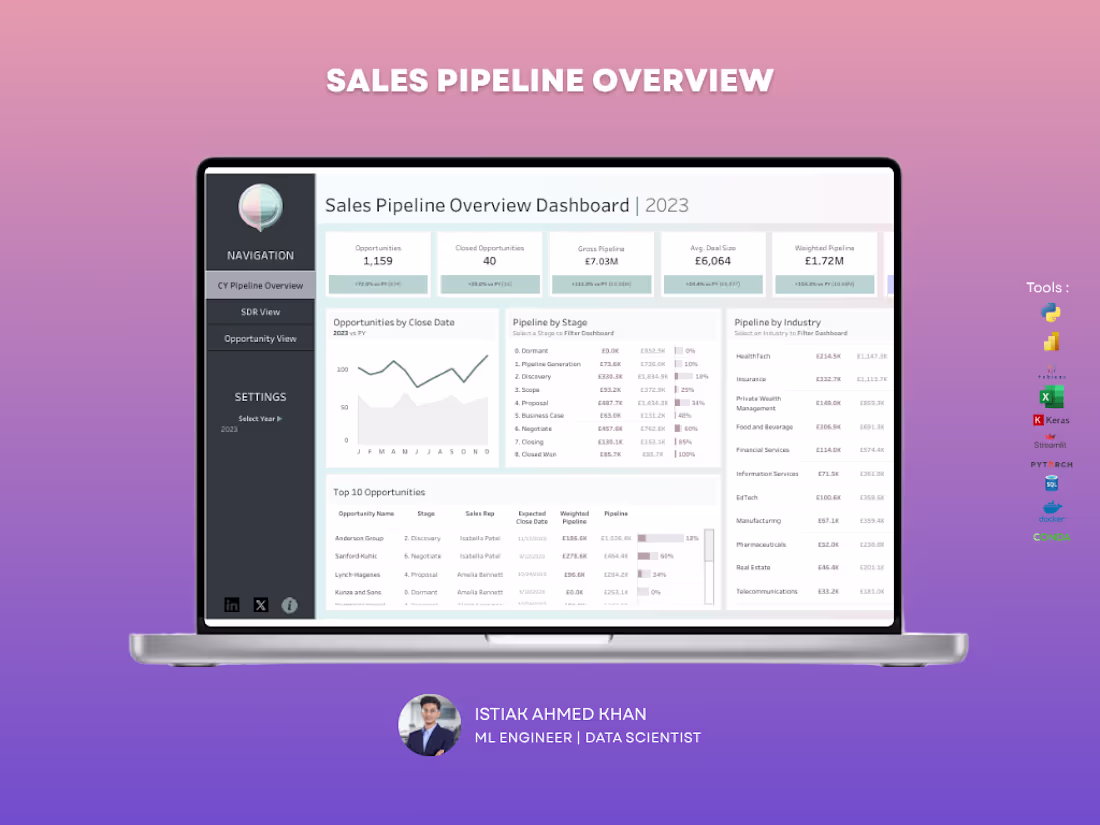
Sales Pipeline Dashboard – Tableau
Struggling to track your sales pipeline and forecast revenue accurately? This dashboard gives you a clear, real-time view of your entire sales funnel, helping you stay on top of opportunities and close deals faster.
What You Get
A centralized Tableau dashboard that brings together pipeline value, deal stages, and performance metrics into one intuitive view. No more scattered reports — everything you need is in one place.
Key Capabilities
Track total opportunities and closed deals
Monitor gross pipeline and weighted pipeline value
Analyze pipeline by sales stage to identify bottlenecks
Compare pipeline performance across industries
View top opportunities and deal progress
Understand average deal size and close trends
Why It Matters
Without visibility into your pipeline, it’s easy to miss opportunities and misjudge forecasts. This dashboard helps you identify stuck deals, improve conversion rates, and predict revenue more accurately.
Perfect For
Sales teams and managers
B2B companies
Startups scaling their sales process
Agencies managing multiple clients
Let’s Build Yours
If you want a high-impact Tableau dashboard that turns your sales data into actionable insights, I can create a custom solution tailored to your business.
4
10
384
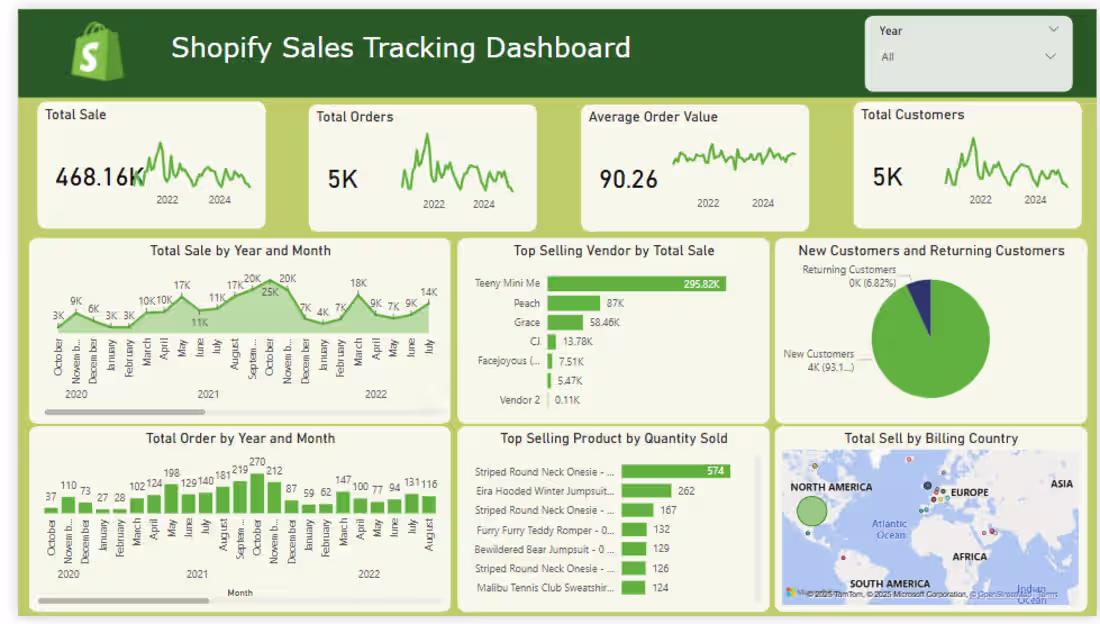
Shopify Sales Tracking Dashboard – Power BI:
This Shopify Sales Tracking Dashboard provides a comprehensive overview of e-commerce performance, sales trends, and customer behavior. Built using Power BI, the dashboard transforms raw Shopify data into actionable insights that help store owners optimize revenue, marketing strategy, and operational efficiency.
3
685
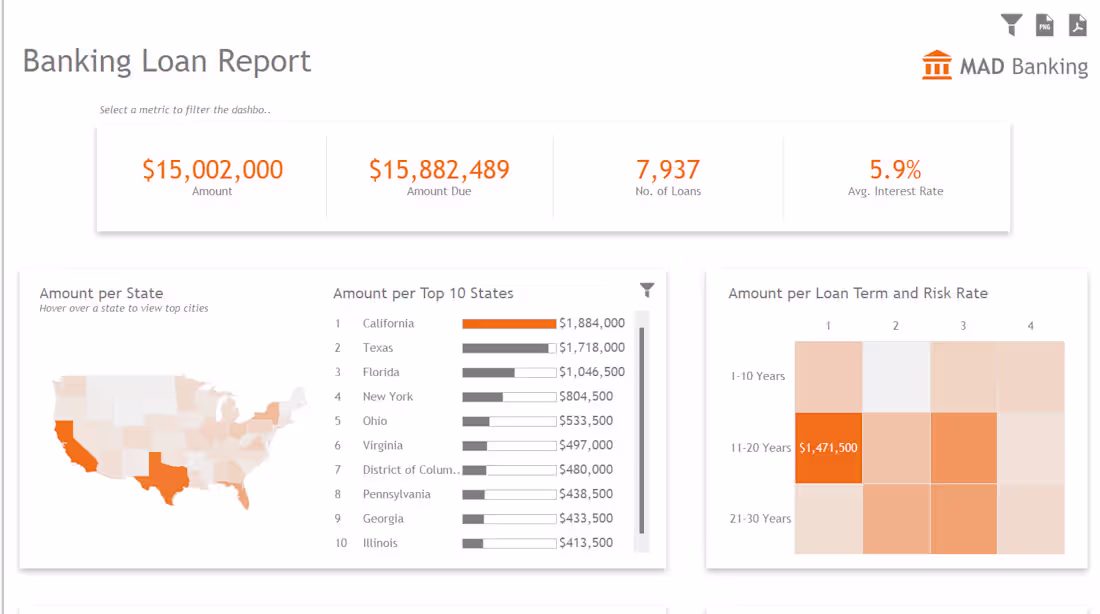
Tableau banking loan report
3
7
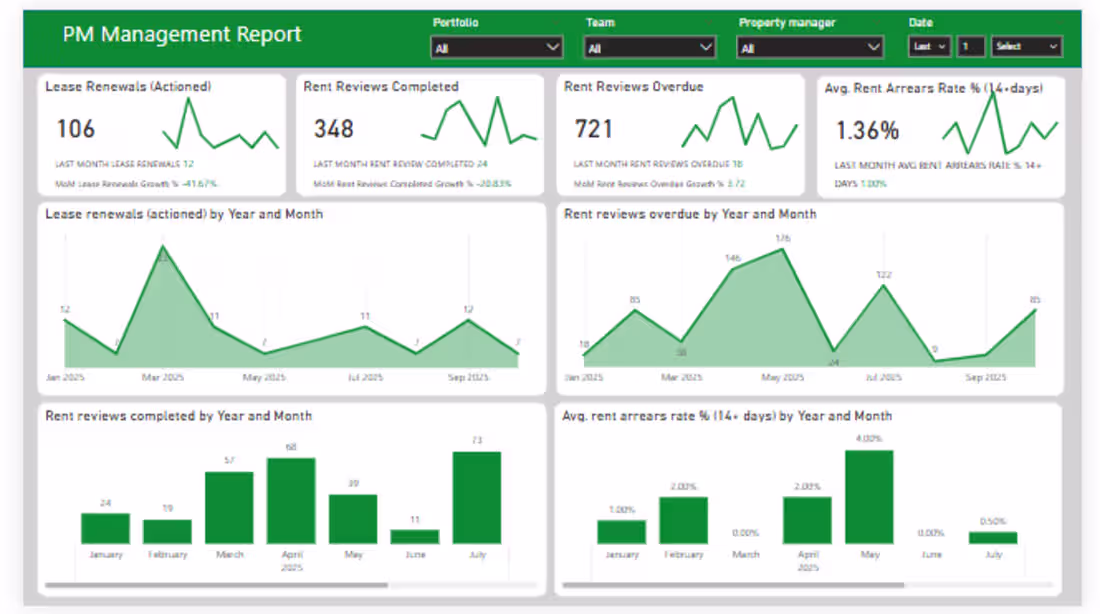
Portfolio Management Report – Power BI:
This Portfolio Management Report is designed to provide real-time visibility into property performance, lease management, and rental compliance metrics. Built in Power BI, the dashboard enables property managers and asset managers to monitor operational efficiency, identify risks, and optimize revenue performance across the portfolio.
1
5
760
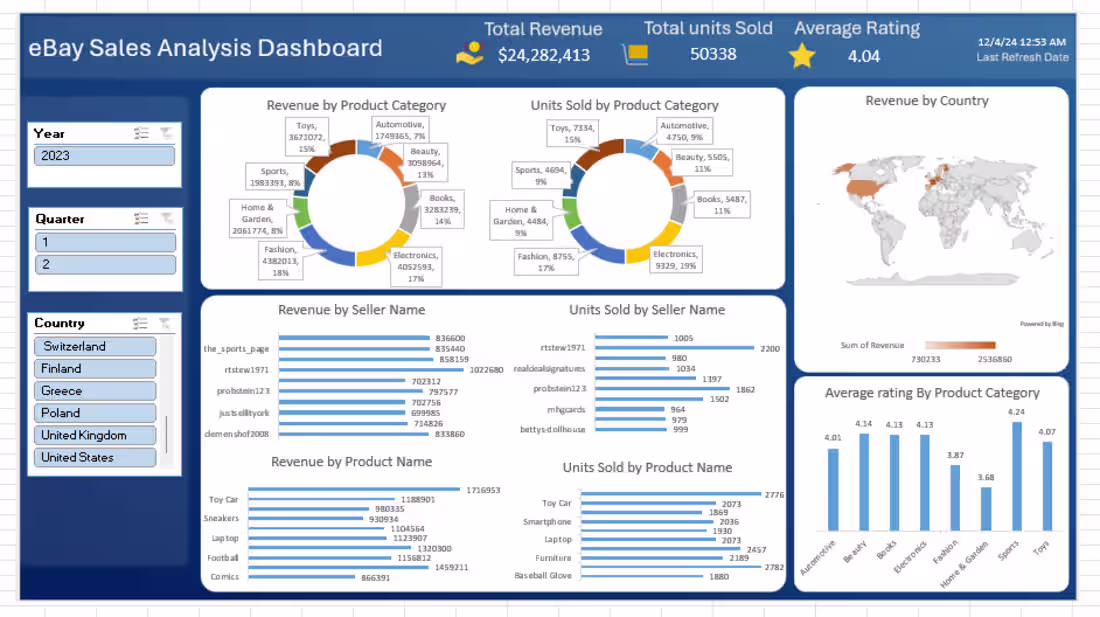
eBay Sales Analysis Dashboard in Microsoft Excel :
E-commerce platforms generate large volumes of transactional data, making it difficult to track performance across products, sellers, and regions. Without a centralized dashboard, identifying top-performing categories, understanding customer behavior, and monitoring sales trends becomes challenging.
Key Metrics
Total Revenue: $24.28M
Total Units Sold: 50,338
Average Rating: 4.04
These KPIs provide a quick snapshot of overall business performance and customer satisfaction.
Business Impact:
Identifies top-performing products and categories
Enhances seller performance evaluation
Improves market targeting and regional strategy
Supports data-driven pricing and inventory decisions
Tracks customer satisfaction for quality improvement
7
7
668
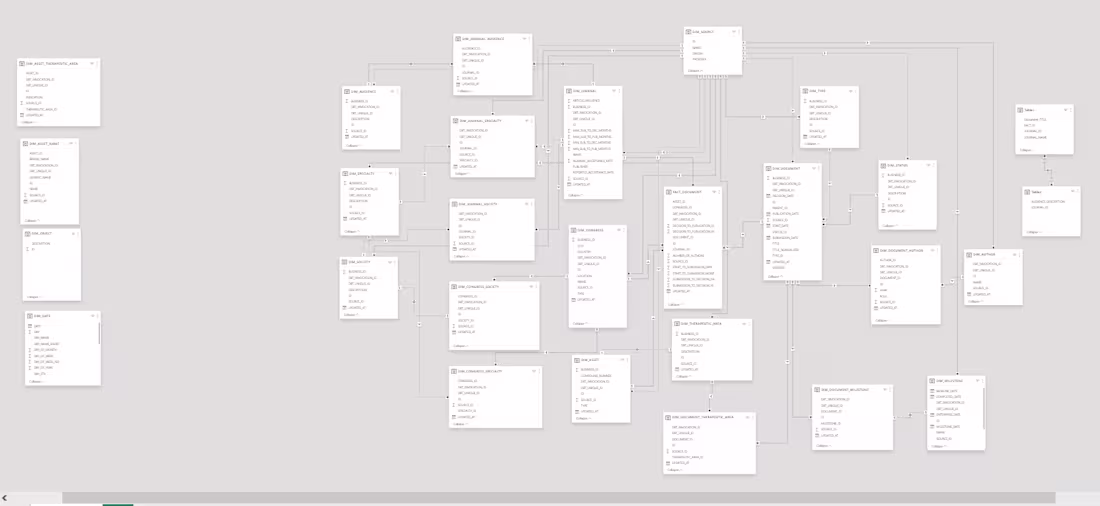
Data modeling in Microsoft Power BI is the foundation of accurate and high-performance dashboards.
1. Use Star Schema
Fact table → numeric data (Sales, Revenue)
Dimension tables → descriptive data (Customer, Product, Date)
Keep fact in center, dimensions around it
2. Relationships (When to Use What)
One-to-Many (1:*) → Best practice (Dimension → Fact)
Many-to-One (*:1) → Same as above, reversed view
One-to-One (1:1) → Rare, use only if necessary
Many-to-Many (:) → Avoid; use bridge table instead
3. Filter Direction
Single direction → Recommended (Dimension → Fact)
Bi-directional → Use only for complex cases
4. Data Preparation
Clean data in Power Query
Remove duplicates, fix types, handle nulls
5. DAX Measures
Use measures (SUM, CALCULATE) over columns
6. Best Practices
Use a proper Date table
Keep dimension values unique
1
3
427