Coffee Shop Sales Analysis
Arsal Khan
Problem objectives:
Mysql Queries with full explanation
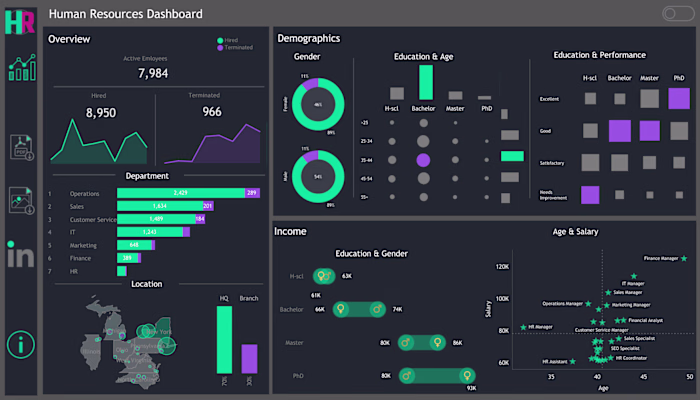
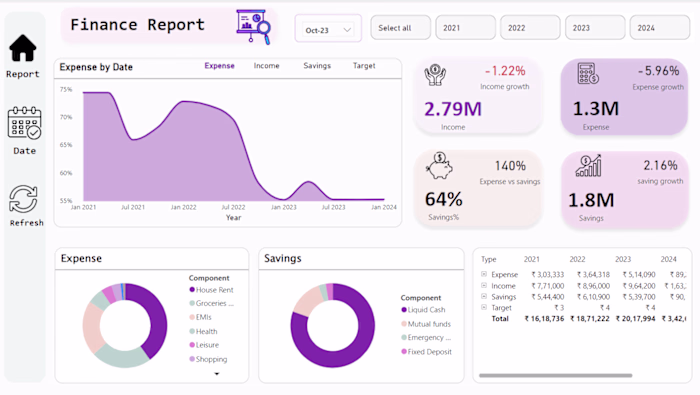
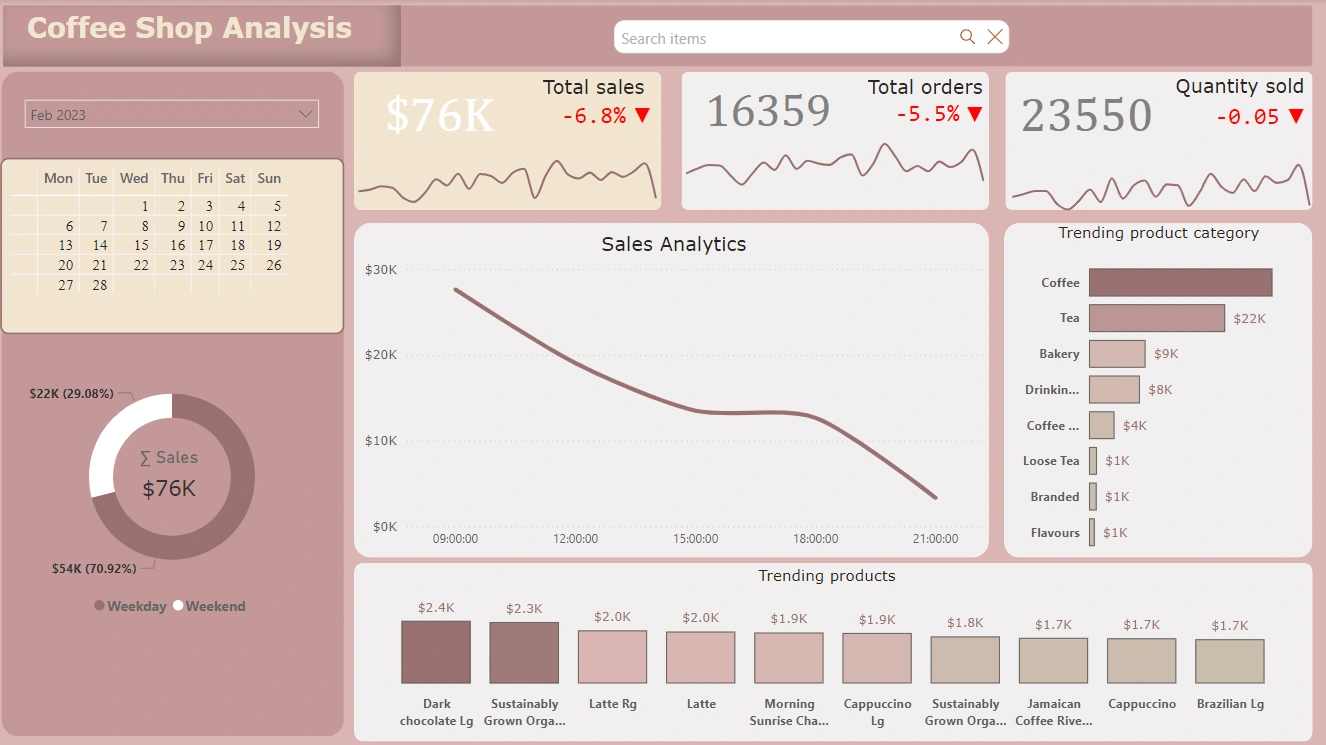
Power Bi Dashboard
Summary:
The dataset includes transaction records with information on transaction dates, times, sales quantities, and product categories. By applying various SQL queries, the report covers the following key areas:
1. Data Preparation and Cleaning
Date and Time Formatting: Transaction dates and times were converted to standardized formats (
DATE and TIME data types) to facilitate accurate date-based calculations and comparisons.Column Renaming: The transaction ID column was renamed for consistency and ease of reference.
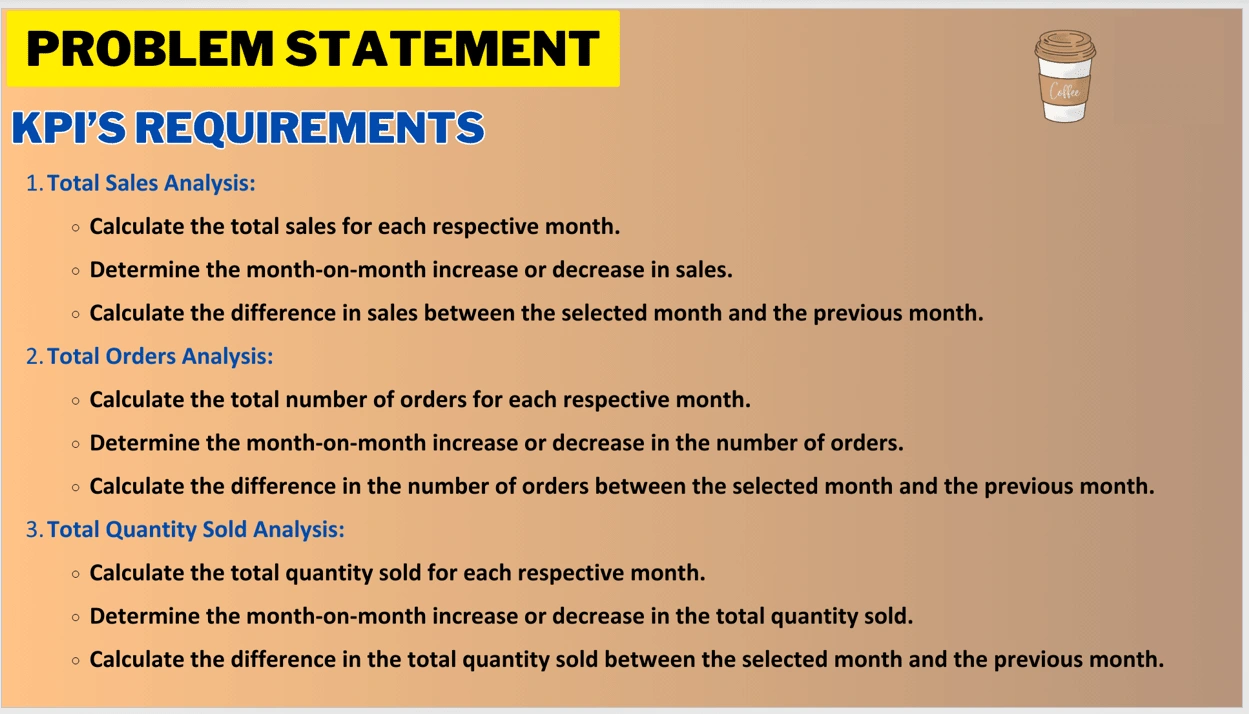
2. Key Performance Indicators (KPIs)
Total Sales: Calculated by summing the product of unit prices and transaction quantities. Specific focus was placed on analyzing sales for individual months (e.g., May).
Total Orders: Measured by counting unique transaction IDs within the specified month.
Total Quantity Sold: Aggregated from transaction quantities to understand volume sold.
3. Month-over-Month (MoM) Growth Analysis
Sales, Orders, and Quantity MoM Comparison: Using the
LAG function, the analysis tracks monthly differences in total sales, total orders, and total quantity sold, highlighting percentage growth or decline from one month to the next (April to May).4. Sales Trends
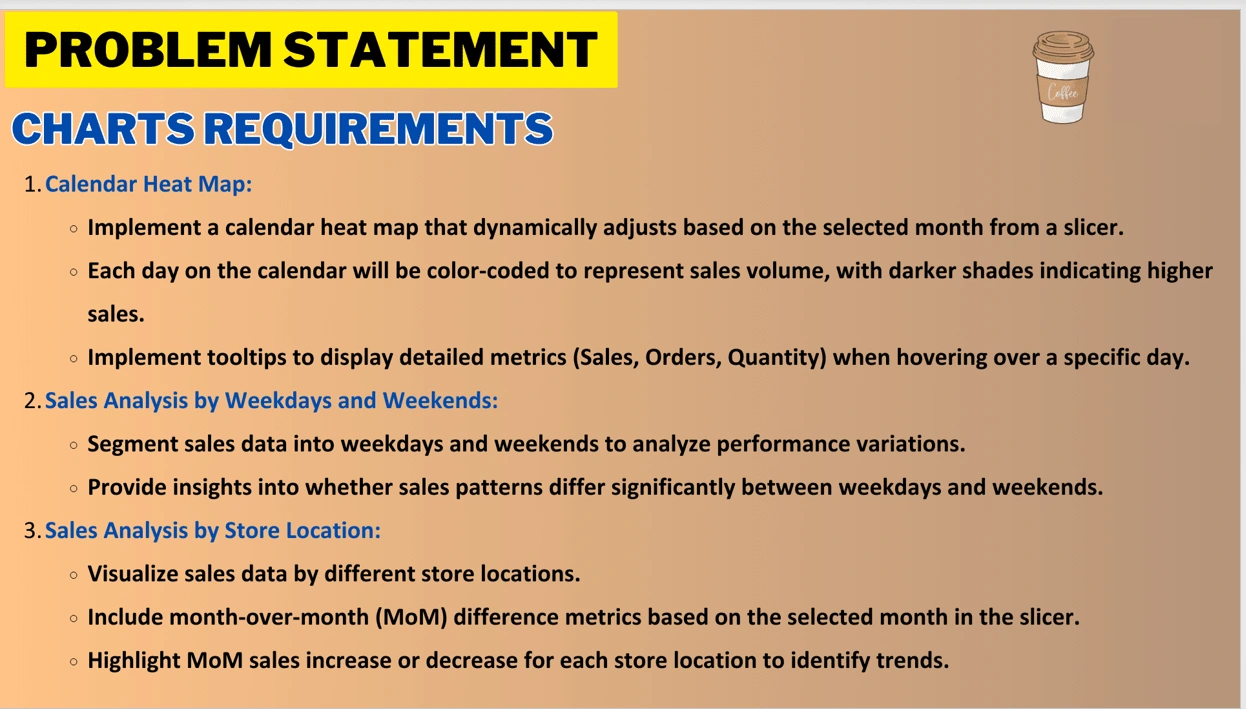
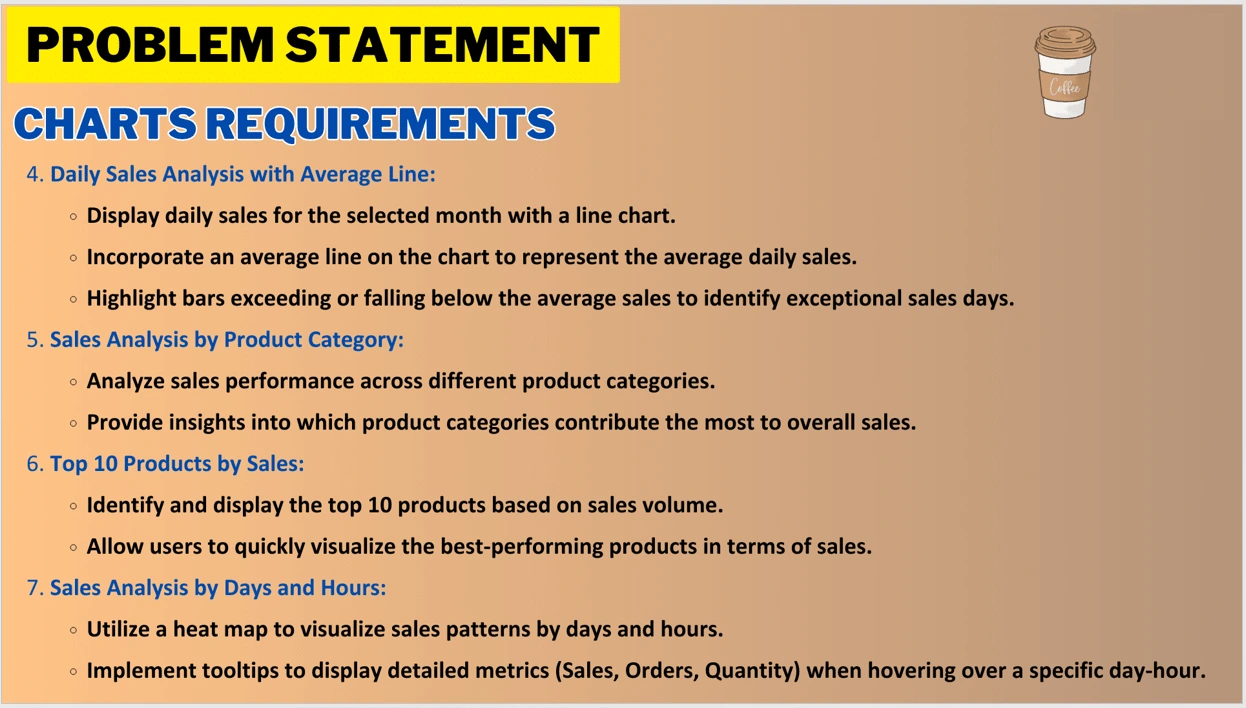
Daily and Weekly Sales Trends: Analyzed daily sales performance, comparing it to the average daily sales for May to categorize days as "Above Average," "Below Average," or "Average" in sales.
Weekday vs. Weekend Sales: Segmented sales based on whether transactions occurred on weekdays or weekends, providing insights into customer behavior patterns.
5. Location and Product Insights
Sales by Store Location: Aggregated total sales for each store location, ordered by performance to identify top-performing branches.
Product Category and Product Type Analysis: Sales by product category and the top 10 product types were analyzed to determine popular items and high-revenue categories.
6. Hourly Sales Patterns
Sales by Hour and Day: Detailed hourly sales on a specific day (e.g., Tuesday) and a comprehensive view of hourly sales for the entire month of May. This helps in staffing and inventory planning by understanding peak hours.
7. Aggregate and Summary Insights
Average Sales Calculation: An average sales metric was created by averaging total daily sales for May, aiding in performance benchmarking.
Overall Sales Trend: By analyzing monthly sales data, the overall growth trend is determined, helping in identifying high and low sales periods.
This SQL-based report provides comprehensive insights into the coffee shop's operations and sales trends, enabling informed decision-making regarding inventory management, staffing, and marketing. The analysis is flexible and can be adapted for continuous monitoring or used as a basis for building automated dashboards in BI tools.
Like this project
Posted Oct 29, 2024
Coffee Shop Sales Analysis - This project has accomplished on two different analytical tool SQL & Power Bi. Report Overview This report provides insights.