The network for creativity
Join 1.25M professional creatives like you
Connect with clients, get discovered, and run your business 100% commission-free
Creatives on Contra have earned over $150M and we are just getting started
Back to feedPost
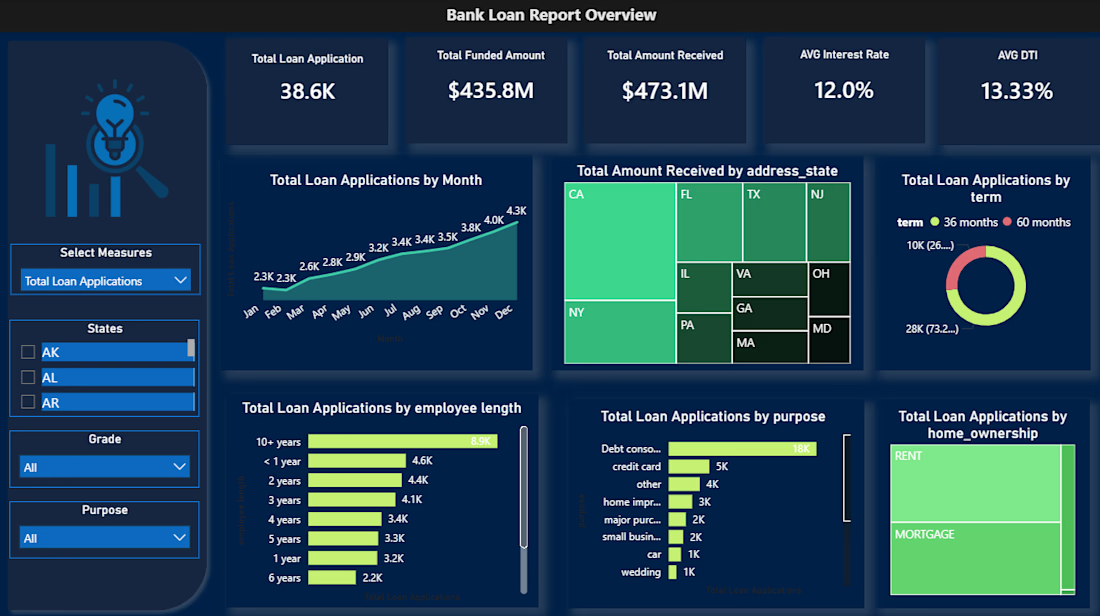
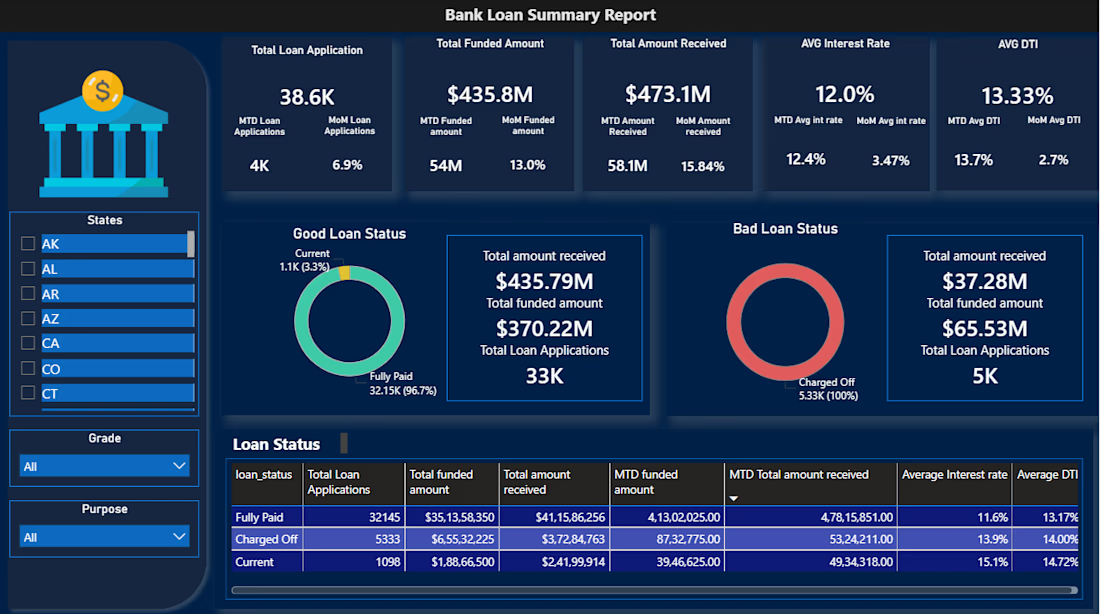
🏦 Bank Loan Portfolio Analysis | Power BI Dashboard Project
Analyzed 38,576 loan records across 50 states to give a bank's lending division a unified view of portfolio health — something they simply didn't have before.
What the data revealed:
✅ Net-positive portfolio: $435.8M disbursed, $473.1M recovered
⚠️ 13.8% bad loan rate = $28.25M net capital loss
📊 Debt consolidation drives nearly half of all loan applications
⏳ 73% of borrowers chose 60-month terms over 36-month
📍 60%+ of repayments concentrated in just 5 states (CA, NY, FL, TX, NJ)
Tools used: PostgreSQL → Excel → Power Query → Power BI + DAX
Built two interactive dashboards:
→ Summary: KPI cards, good vs. bad loan segmentation, loan status grid
→ Overview: Trends, geographic maps, term/purpose/employment breakdowns
The next phase? Building a predictive risk scoring layer using DTI, interest rate, and employment length to flag at-risk loans before they default.
Open to feedback from data folks in the community 👇
#PowerBI #DataAnalytics #SQL #DAX #BankingAnalytics #PortfolioAnalysis #DataVisualization
The network for creativity
Join 1.25M professional creatives like you
Connect with clients, get discovered, and run your business 100% commission-free
Creatives on Contra have earned over $150M and we are just getting started
Trending
Claude
Claude has entered the design space. How are you using Claude Design?
Contra University
Learn from expert creatives how to earn more using next-gen AI tools.
creativeaiflow
Creative AI workflows are evolving. What tools do you use, and what are their strengths and weaknesses?
freelancerlife
Freelancer life is wins, pivots, and everything in between. What’s yours right now?
Related posts
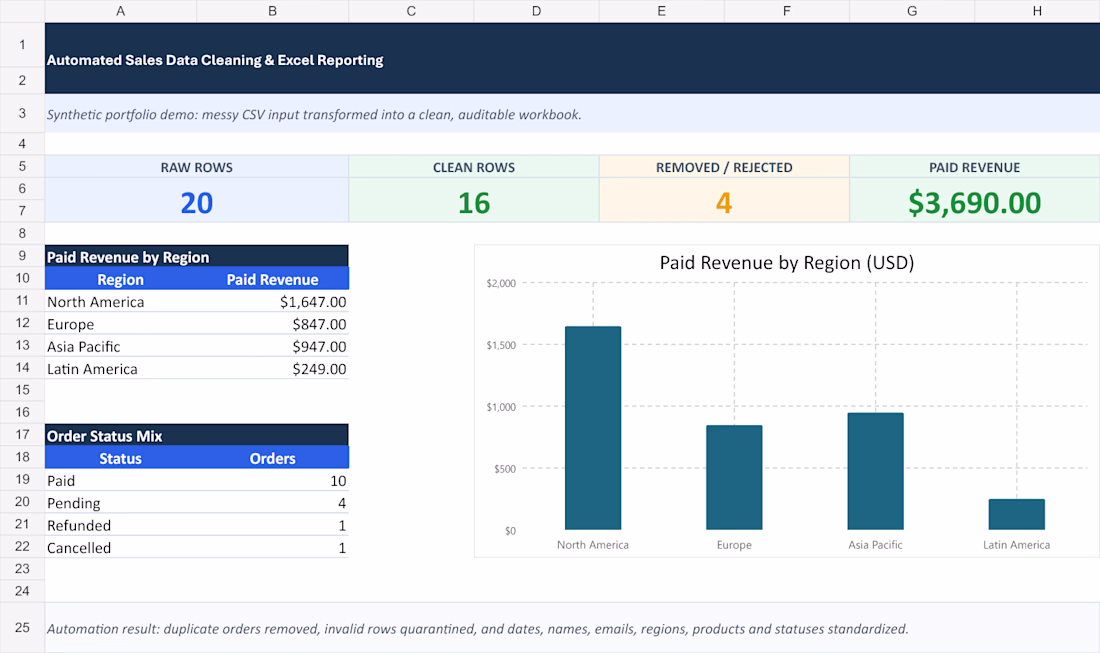
I built a small data-cleaning workflow around one simple rule: bad rows should never silently disappear.
Synthetic demo results:
• 20 raw order records
• 16 clean rows
• 2 duplicates removed
• 2 invalid rows quarantined
• $3,690 paid revenue reconciled
The output includes a clean CSV, a rejected-row file, an audit log, and an Excel dashboard. Dates, names, emails, regions, products, and payment statuses are standardized.
The key design choice is quarantine + reasons, not just dropping bad rows and exporting. That lets a reviewer trace exactly what changed and decide whether rejected records should be repaired.
For recurring exports, what needs the most manual review in your workflow: duplicates, inconsistent labels, or invalid amounts and dates?
Title:
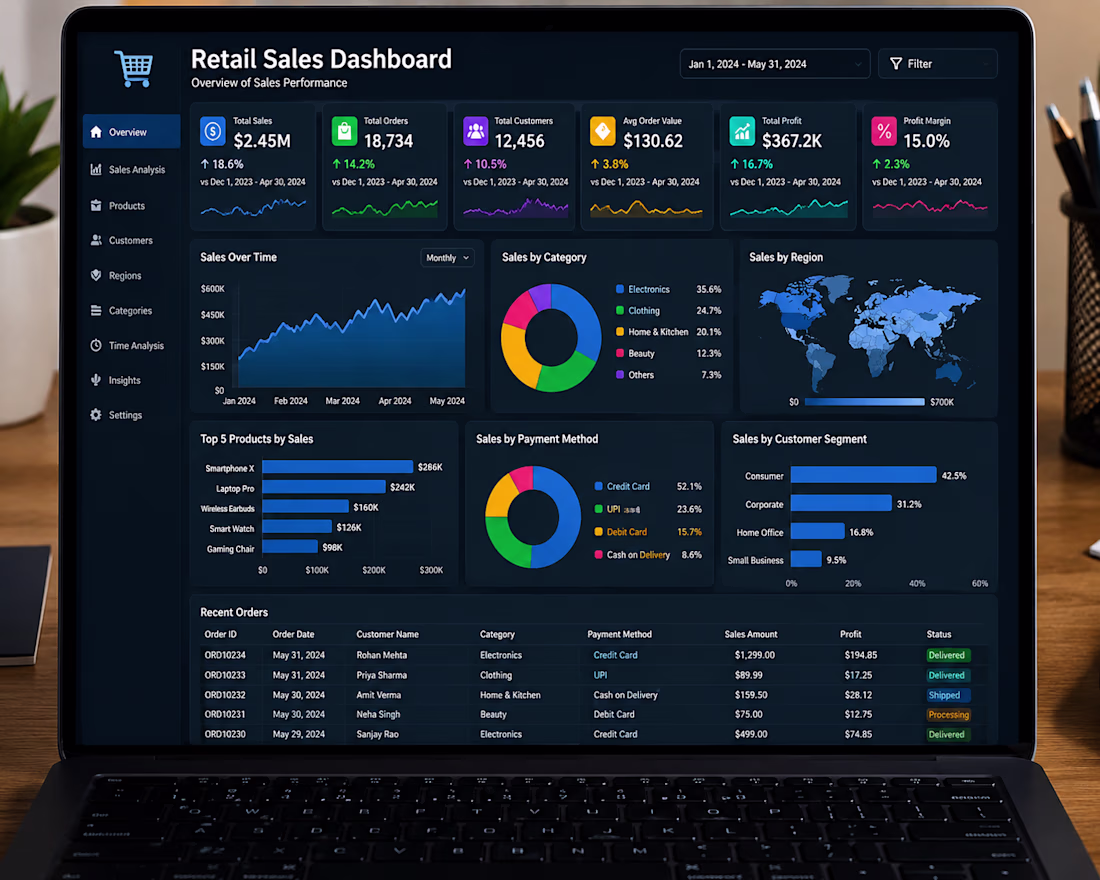
🛒 Retail Sales Dashboard
Description:
Built an interactive Retail Sales Dashboard to monitor total sales, customer orders, product performance, regional sales, payment methods, and revenue trends. Designed dynamic KPI cards, sales insights, and interactive visualizations using Microsoft Excel, SQL, and Power BI to help businesses improve retail performance and make data-driven decisions.
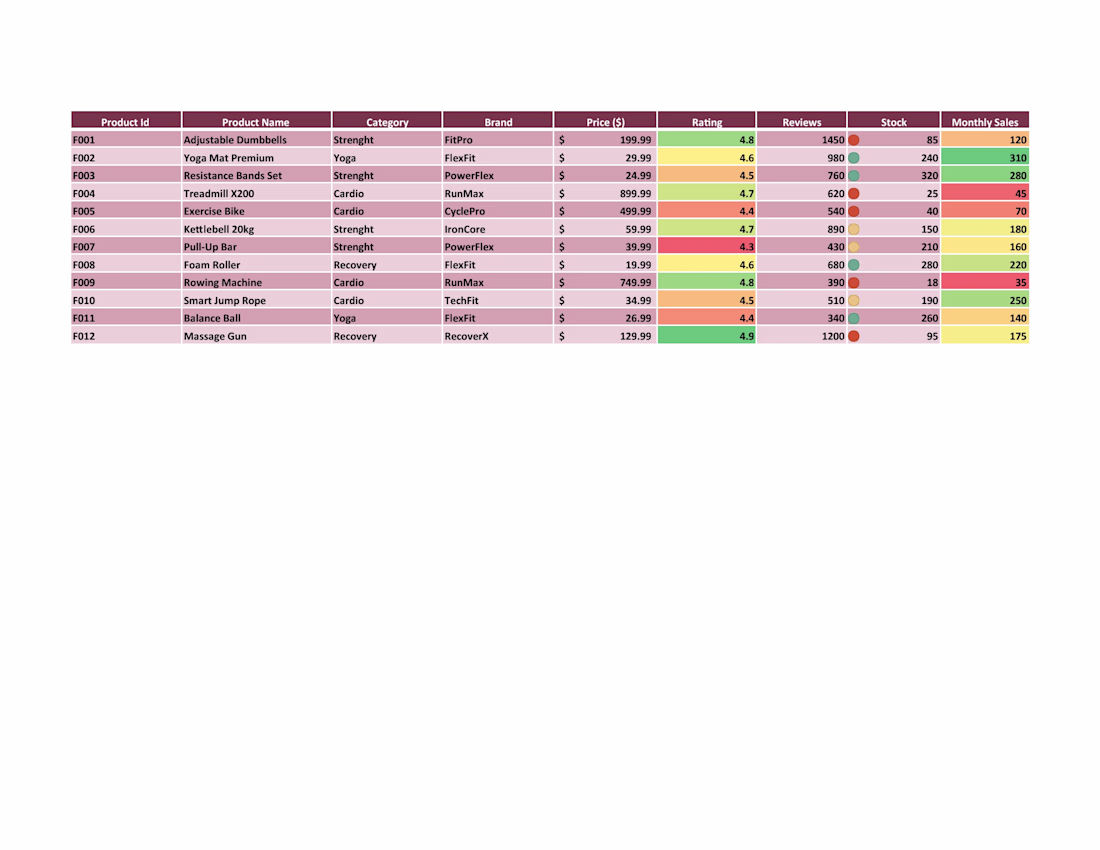
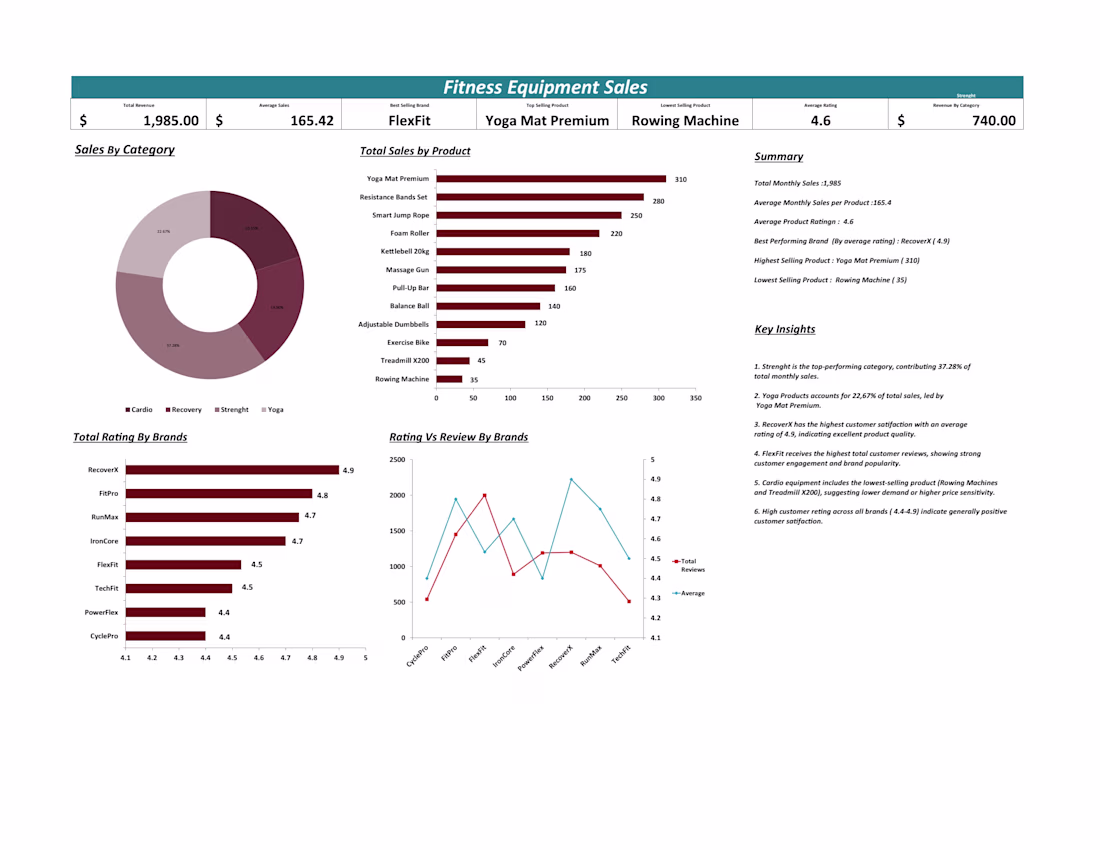
Performed comprehensive web research on fitness equipment by gathering accurate information from trusted online sources. Collected details including product names, brands, equipment categories, features, specifications, prices, customer ratings, and intended use. Organized, verified, and formatted the data in Microsoft Excel to create a structured dataset suitable for market research, competitor analysis, product comparison, and business decision-making. Demonstrated attention to detail, web research, data entry, and Excel proficiency.