AI Automation & Business Systems Expert | Make.com, Zapier
AI Automation & Business Systems Expert | Make.com, Zapier


Transforming Data into Actionable Insights 🔍
Transforming Data into Actionable Insights 🔍
Data Analysis & AI: Results-Driven Expertise
Data Analysis & AI: Results-Driven Expertise
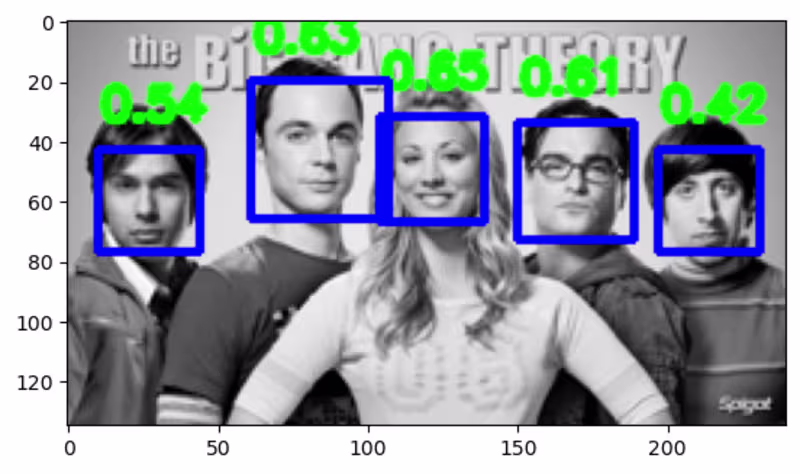
Data Scientist | Data Analyst | Machine Learning
Data Scientist | Data Analyst | Machine Learning
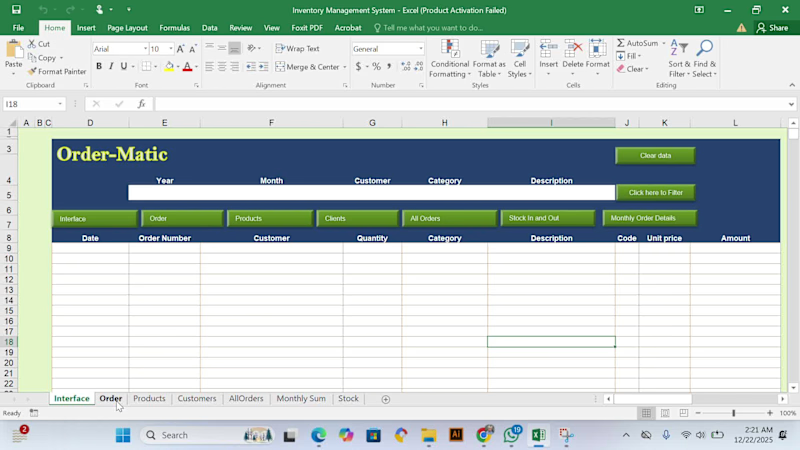
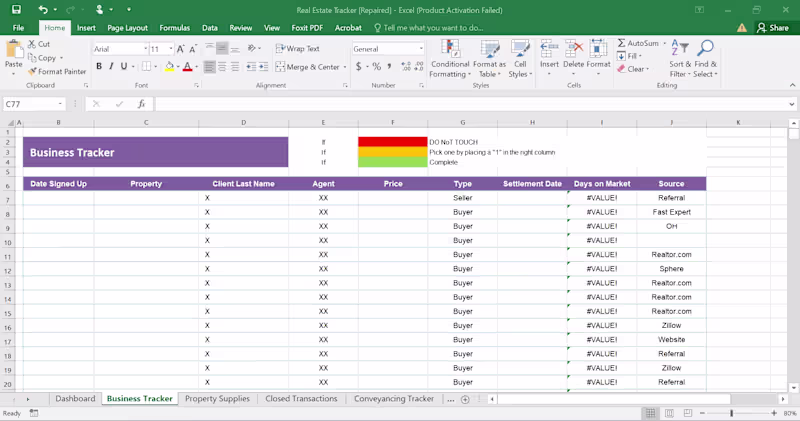
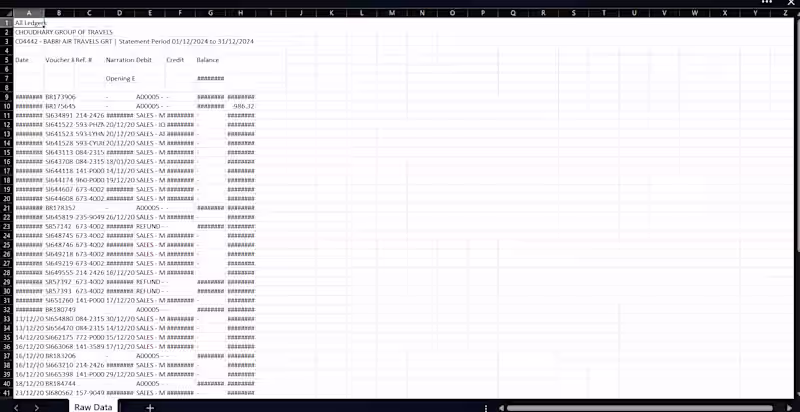
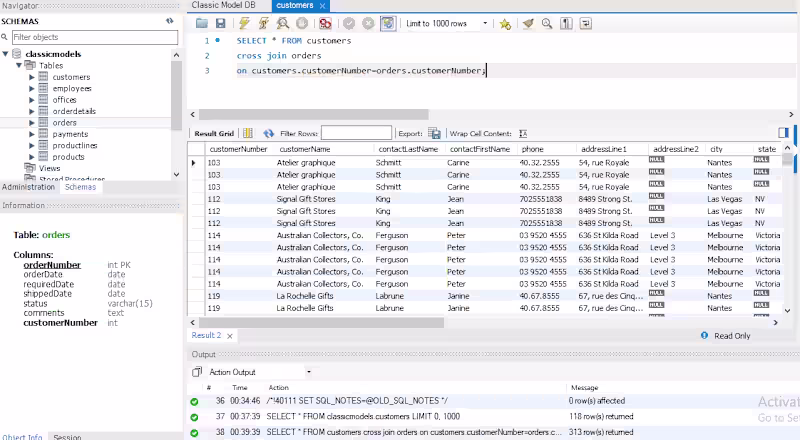
Expert Data Analyst specializing in Excel & SQL
Expert Data Analyst specializing in Excel & SQL
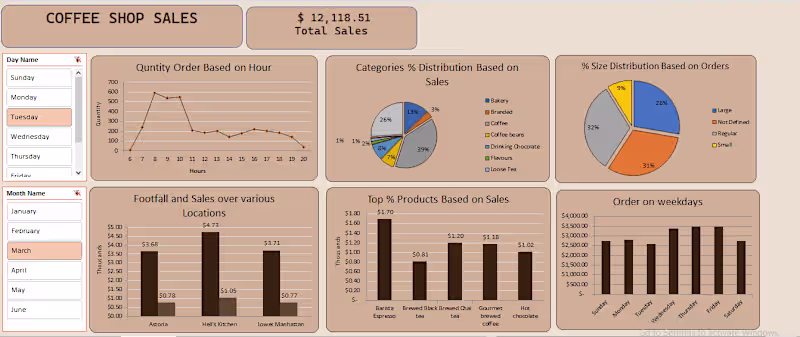
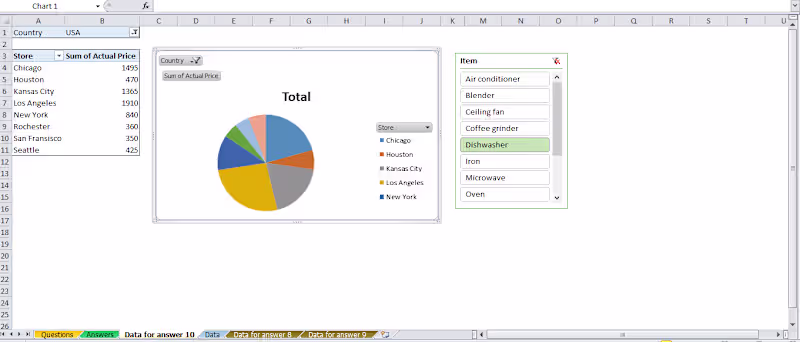
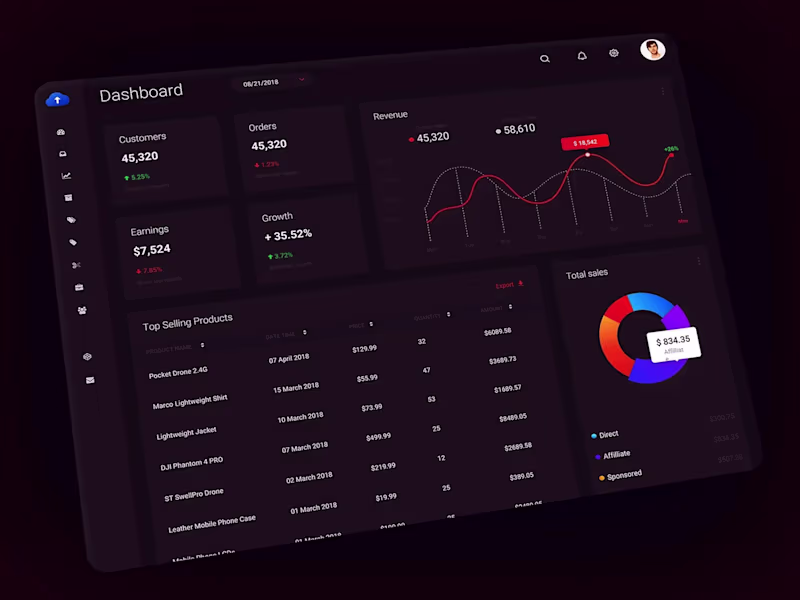
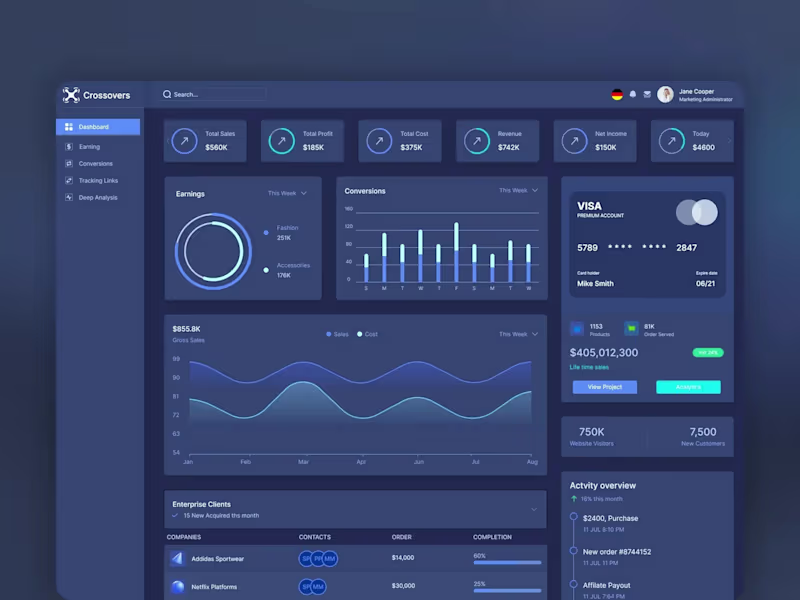
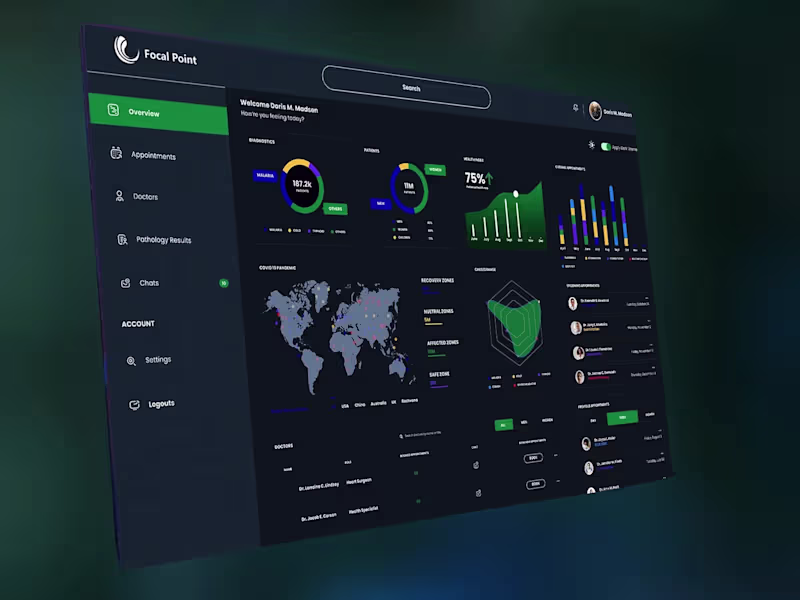
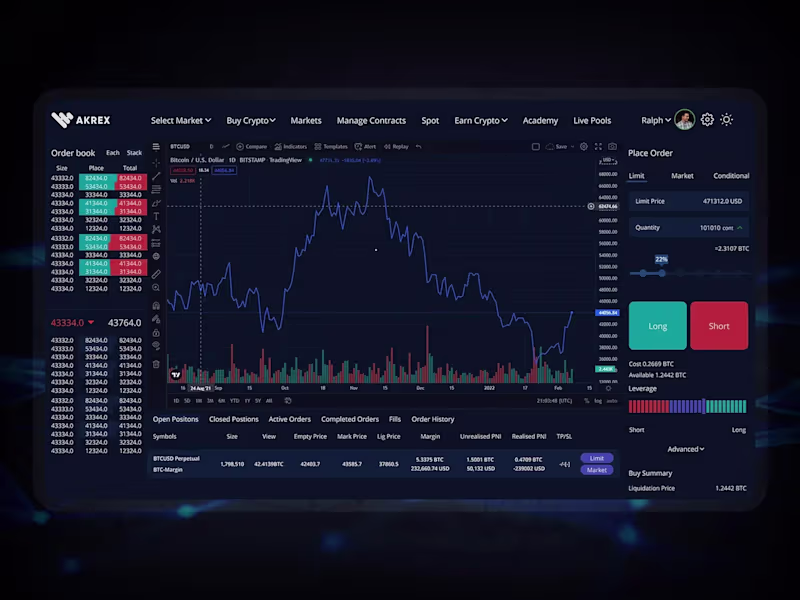
Transforming Raw Data into Insightful Dashboards
Transforming Raw Data into Insightful Dashboards
Certified UX/UI Designer and Digital Marketer
Certified UX/UI Designer and Digital Marketer
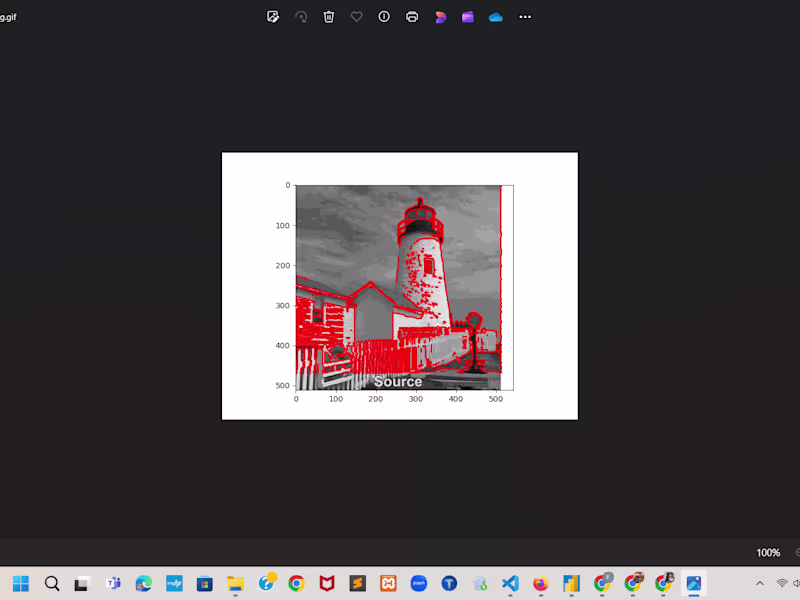
🔍 Data Wizard: Analysis to AI Solutions 🤖
🔍 Data Wizard: Analysis to AI Solutions 🤖