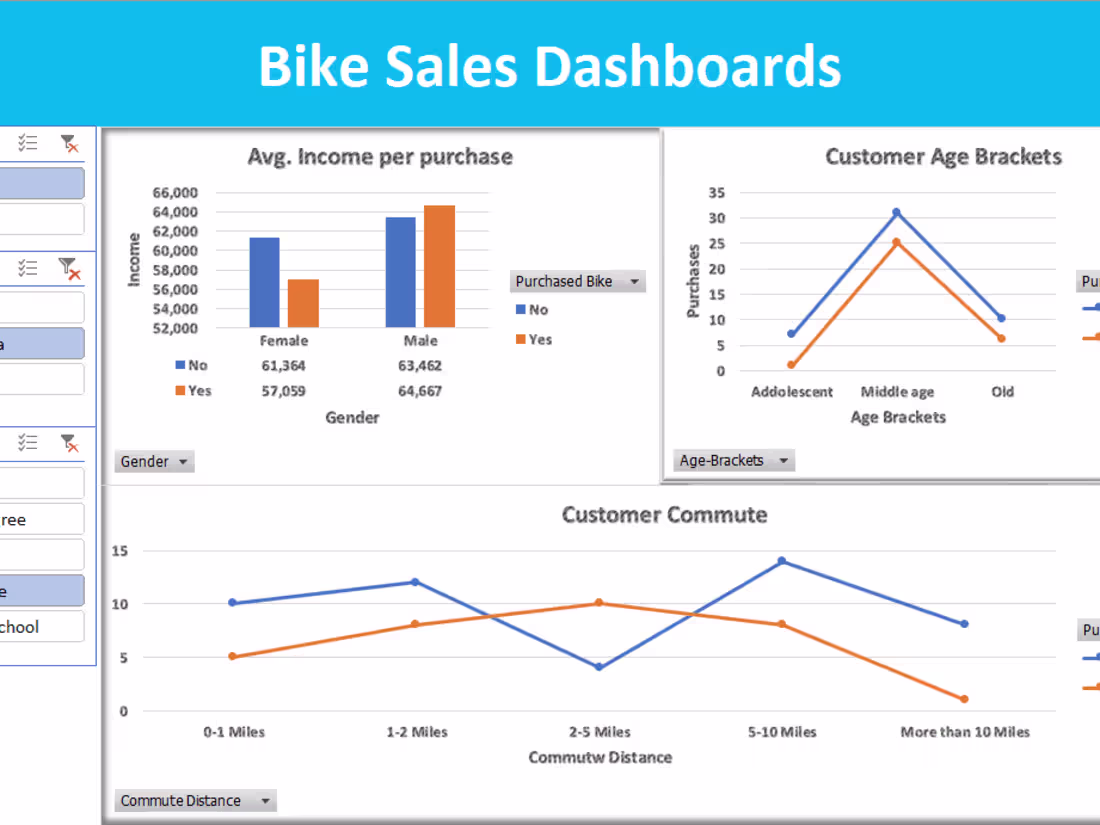
Transforming Raw Data into Insightful Dashboards

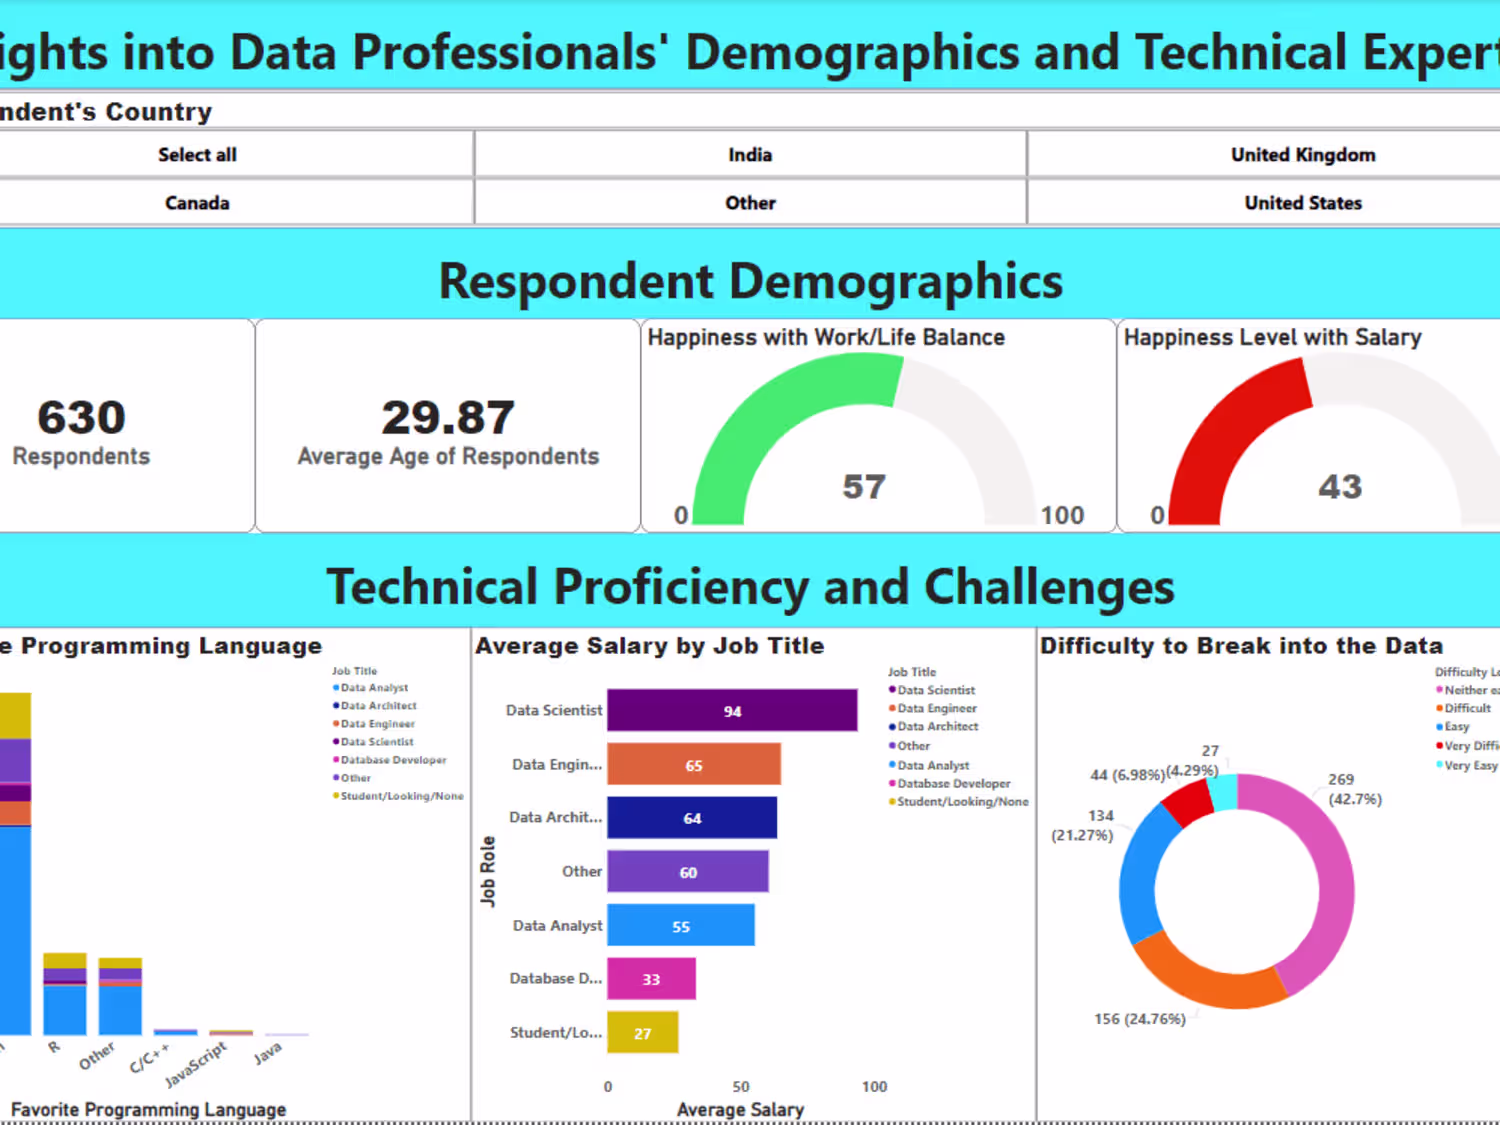
Insights-into-the-Data-Professionals-Demographical-and-Expertis…

A survey was taken by different Data professionals. I analyzed, visualized and cleaned data and created interactive dashboard providing clear picture about them

Data Scientist
Data Visualizer
Data Analyst
Microsoft Excel
Microsoft Power BI

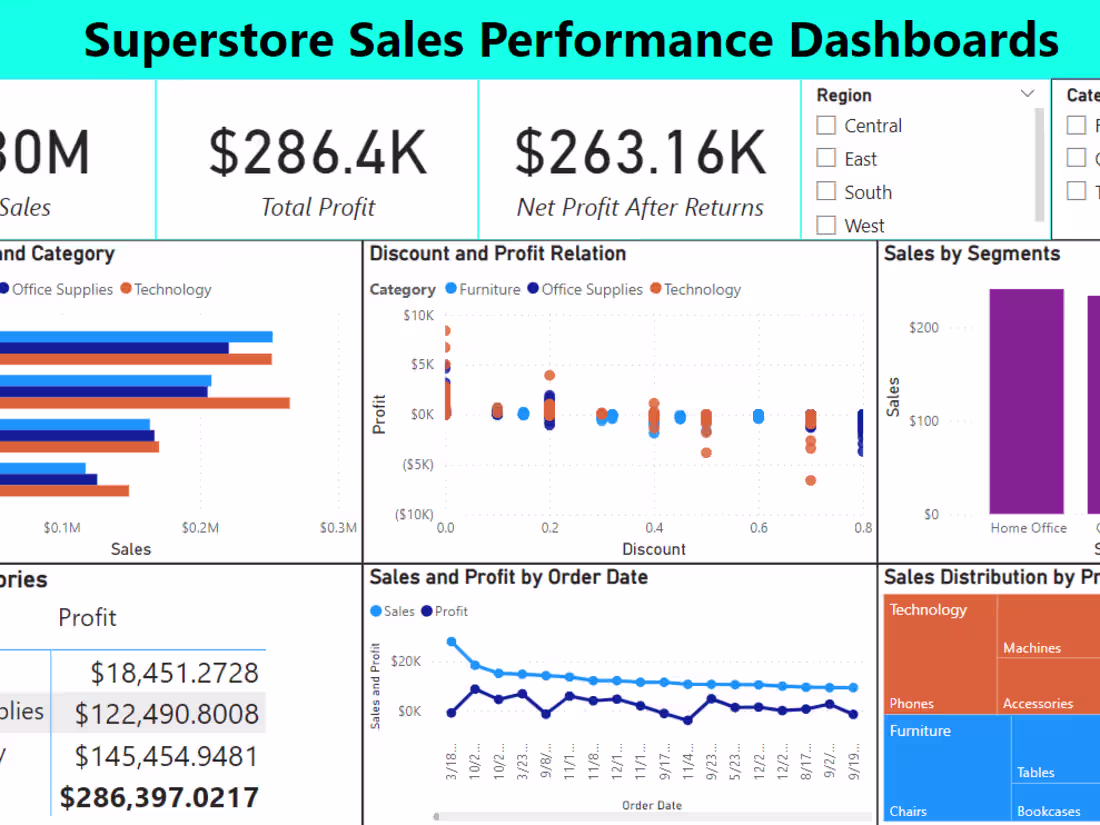
Superstore-Performance-Dashboard

Here Utilizing Power Bi and Excel, I cleaned, transformed, and visualized data along with data modeling techniques. Created Interactive & Insightful Dashboard.

Data Visualizer
Business Analyst
Data Analyst
Microsoft Excel
Microsoft Power BI

Data Visualization
Data Visualization

Summarized and visualized different sort of datasets for different conditions.

Data Visualizer
Data Analyst
Microsoft Excel

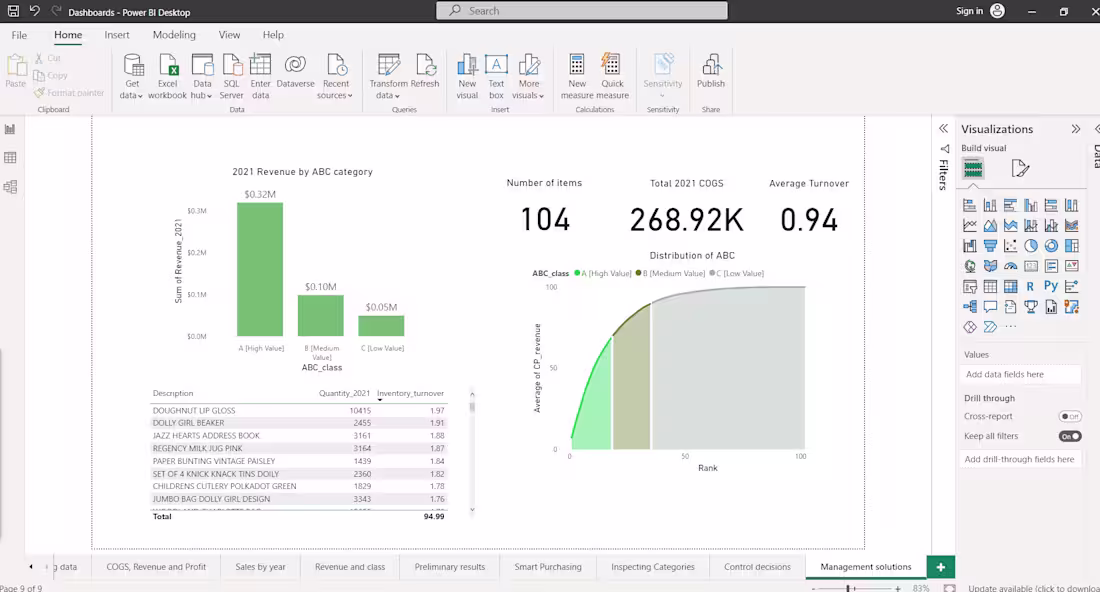
Inventory Analysis in Power Bi

Optimized WarmeHands Inc.'s inventory with a DataCamp case study, using Power BI. Cleaned data, calculated COGS and Revenue, and created an interactive dashboar

Data Visualizer
Business Analyst
Data Analyst
Microsoft Power BI

Customer Data Analysis for Marketing and sales Insights

Here, I analyzed a large customer dataset to identify customer's responses towards purchases through pivot tables and detailed visualizations.

Data Visualizer
Business Analyst
Data Analyst
Microsoft Excel