
Providing Insightful Pictures of your Raw DataZafran Ali Khan
I offer expert data analytics and visualization services using Power BI, Excel, and Tableau, transforming raw data into actionable insights that drive business decisions. With advanced skills in Power BI and Excel, alongside growing expertise in Tableau, I create dynamic dashboards, automate reporting, and deliver tailored solutions to meet specific client needs. My ability to integrate multiple data sources and present complex information in a visually compelling, easy-to-understand format sets me apart from others. I focus on delivering precise, data-driven results with a user-friendly approach.
What's included
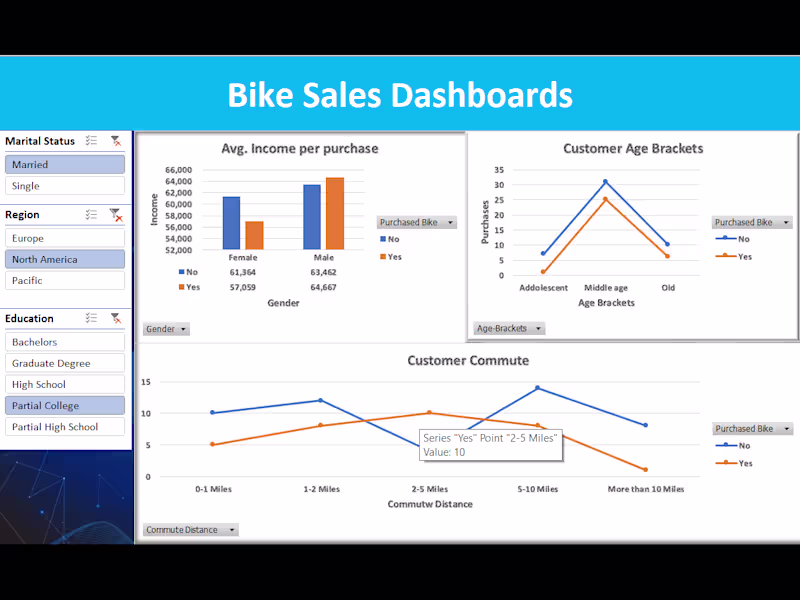
Interactive Dashboards
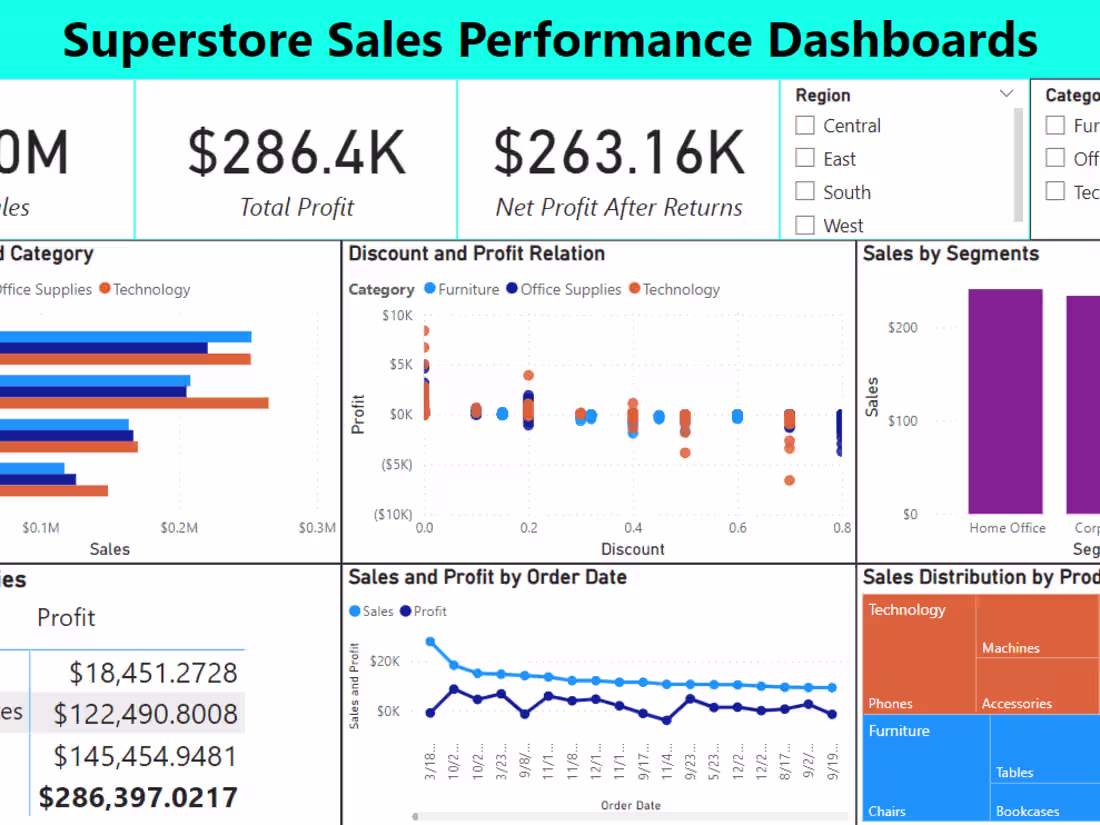
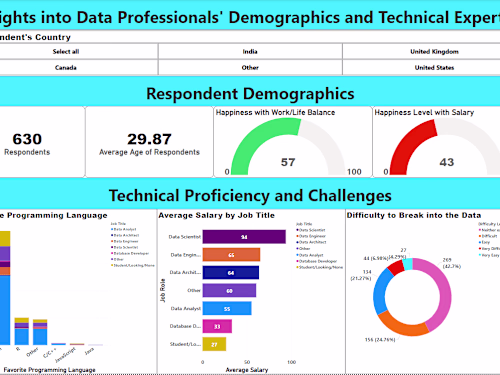
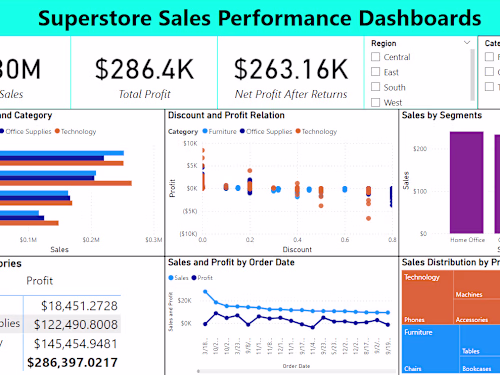
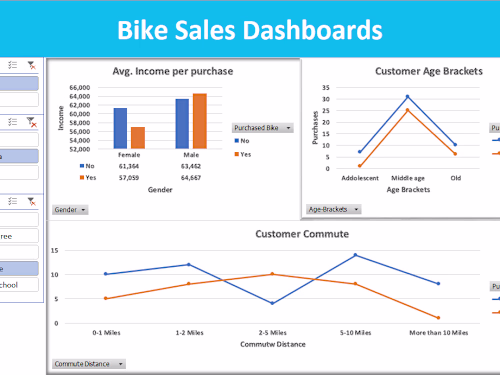
Custom-designed Power BI, tableau dashboards that provide real-time insights into business performance. These dashboards allow users to explore data through dynamic visualizations and easy-to-use filters, making complex data easy to understand and act upon.
Data Modeling
Creation of well-structured data models that enable accurate analysis and reporting. This includes connecting multiple data sources, building relationships, and organizing data to ensure seamless integration with Power BI's reporting tools.
Data Cleansing & Transformation
Cleaning, formatting, and transforming raw data into usable formats for analysis. This ensures that data used in reports is accurate, complete, and reliable, allowing for more precise and meaningful insights.
Consultation & Training
Enhancing the efficiency of Power BI reports, especially for large datasets. Optimized reports will load faster and run more smoothly, improving the user experience and reducing delays in data analysis.
Storytelling with Data
Crafting data stories through visually compelling reports that communicate insights clearly and effectively. These reports will help businesses make data-driven decisions by presenting complex information in a simplified, accessible format.
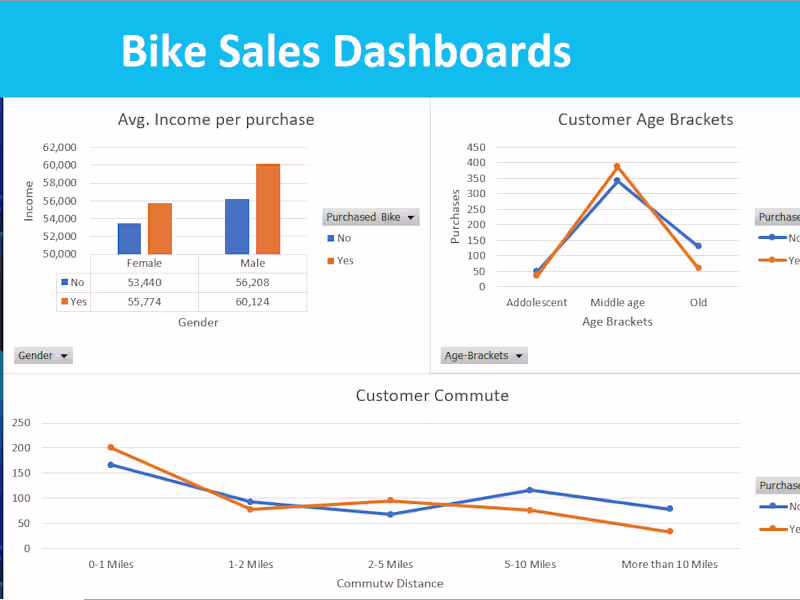
Example work
Contact for pricing
Tags
Microsoft Excel
Microsoft Power BI
Tableau
Data Analyst
Data Modelling Analyst
Data Visualizer
Service provided by
Zafran Ali Khan Daud Khel, Pakistan
Providing Insightful Pictures of your Raw DataZafran Ali Khan
Contact for pricing
Tags
Microsoft Excel
Microsoft Power BI
Tableau
Data Analyst
Data Modelling Analyst
Data Visualizer
I offer expert data analytics and visualization services using Power BI, Excel, and Tableau, transforming raw data into actionable insights that drive business decisions. With advanced skills in Power BI and Excel, alongside growing expertise in Tableau, I create dynamic dashboards, automate reporting, and deliver tailored solutions to meet specific client needs. My ability to integrate multiple data sources and present complex information in a visually compelling, easy-to-understand format sets me apart from others. I focus on delivering precise, data-driven results with a user-friendly approach.
What's included
Interactive Dashboards
Custom-designed Power BI, tableau dashboards that provide real-time insights into business performance. These dashboards allow users to explore data through dynamic visualizations and easy-to-use filters, making complex data easy to understand and act upon.
Data Modeling
Creation of well-structured data models that enable accurate analysis and reporting. This includes connecting multiple data sources, building relationships, and organizing data to ensure seamless integration with Power BI's reporting tools.
Data Cleansing & Transformation
Cleaning, formatting, and transforming raw data into usable formats for analysis. This ensures that data used in reports is accurate, complete, and reliable, allowing for more precise and meaningful insights.
Consultation & Training
Enhancing the efficiency of Power BI reports, especially for large datasets. Optimized reports will load faster and run more smoothly, improving the user experience and reducing delays in data analysis.
Storytelling with Data
Crafting data stories through visually compelling reports that communicate insights clearly and effectively. These reports will help businesses make data-driven decisions by presenting complex information in a simplified, accessible format.
Example work
Contact for pricing