Comprehensive Excel Data Analysis Using Pivot Tables and Charts
Tajamal Hussain
Introduction
Welcome to my comprehensive Excel data analysis project, where I leveraged the power of Pivot Tables and Charts to deliver actionable business insights. As the proud owner of a multinational home appliances retailer, this project showcases a detailed analysis of over 3000 records of sales data, focusing on improving business strategies and performance.
Objectives
This project aimed to answer the following critical business questions:
Total Sales by City: How much in $ was sold in each city?
Sales Volume by Product: Per each home appliance item, how many items were sold?
Revenue Breakdown by Item and Region: A detailed breakdown of total revenue from each item sold across different regions.
Filtered Revenue Analysis: Focus on specific products (Microwave, Oven, Refrigerators) and exclude the NA region.
Sales Performance by Agent: Identify the best sales agent based on average discount % in Colombia.
Hierarchical Sales Report: $ Sales by Region, Country, and Store.
Region-wise Sales Aggregation: Group sales data to show values on a regional basis.
Data Re-organization: Consolidate NA and LATAM into a single entity called "Americas".
Inclusion of Omitted Transactions: Add missing transactions and update the pivot tables accordingly.
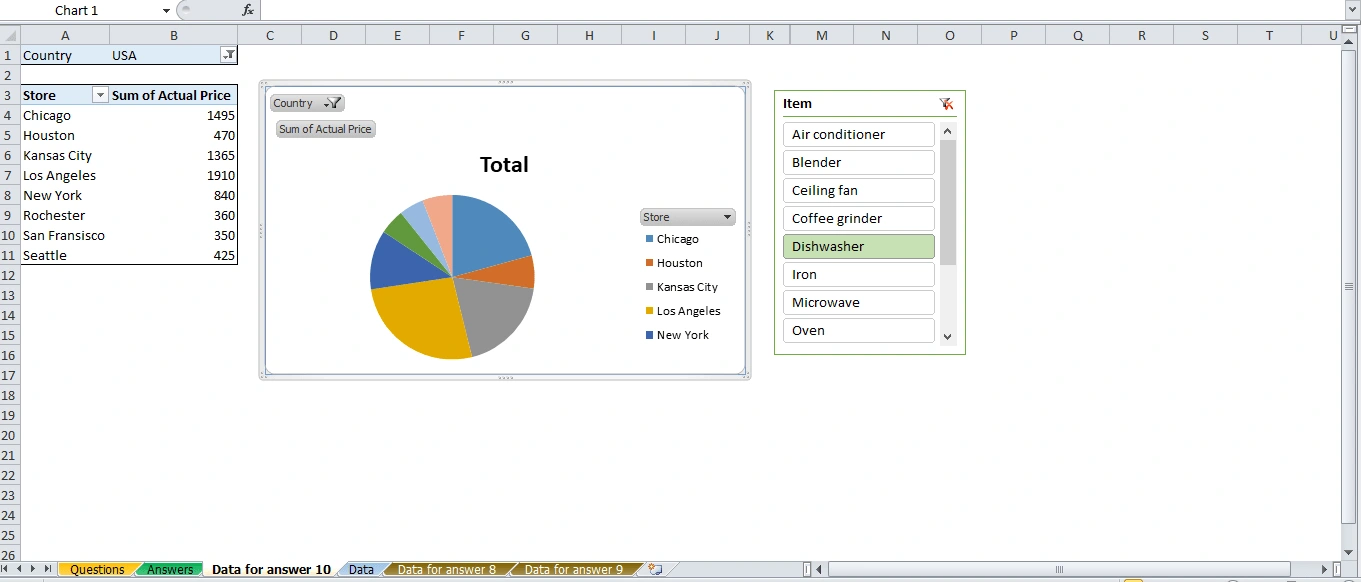
USA Store Sales Pie Chart: Visualise the $ amount of sales per store in the USA.
Interactive Slicer for Pivot Chart: Add a slicer to filter the pivot chart by item.
Methodology
To achieve the above objectives, I utilised the following Excel features and tools:
Pivot Tables: For dynamic data summarisation and analysis.
Charts: Including Pie Charts and Bar Charts for visual representation.
Filters and Slicers: For data segmentation and interactive analysis.
Data Cleaning and Formatting: Ensured data integrity and clarity.
Consolidation Techniques: Combined regions for a holistic view.
Deliverables
The project deliverables include:
Pivot Tables: Answering all key business questions.
Charts and Visuals: Detailed charts for visual insights (see placeholders below).
Formatted Reports: Clean and professional data presentation.
Interactive Elements: Slicers for easy data filtering.
File Data
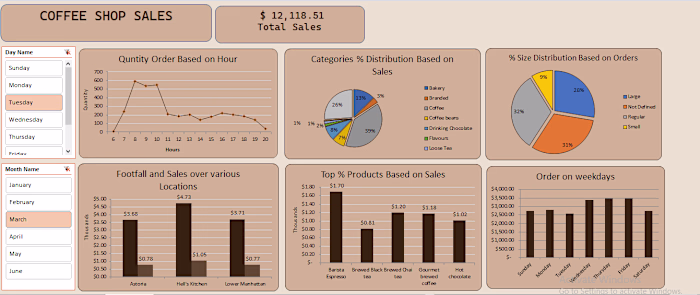
Some Visuals
Total Sales by City
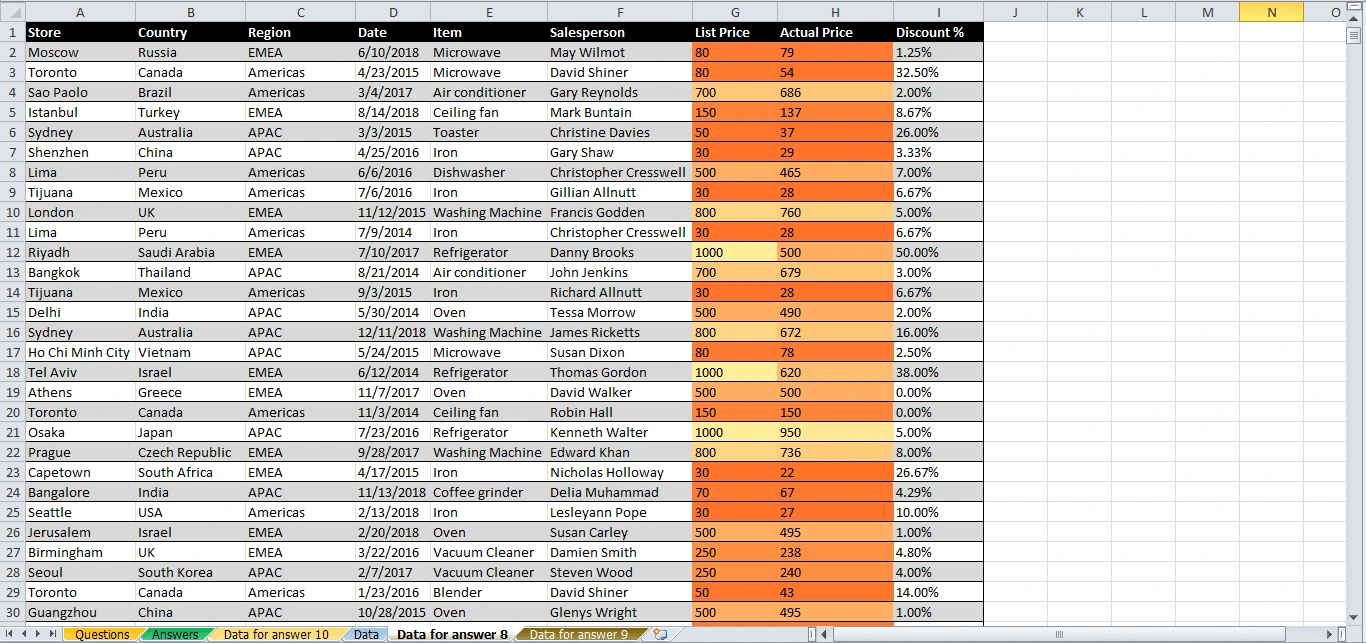
Differentiate between Actual Price and Listed Price
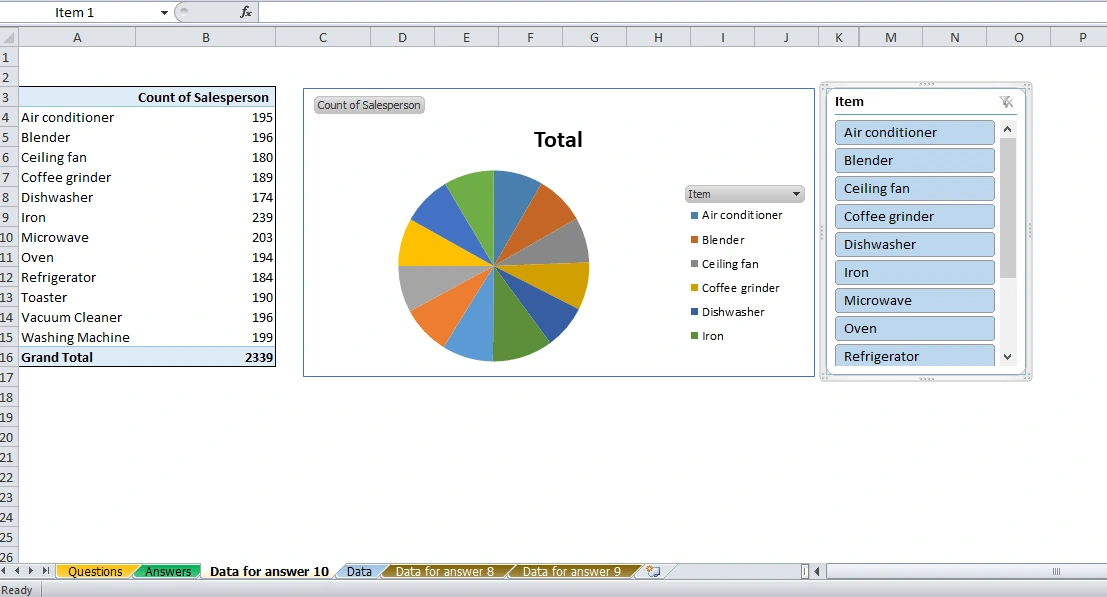
Sales Volume by Product
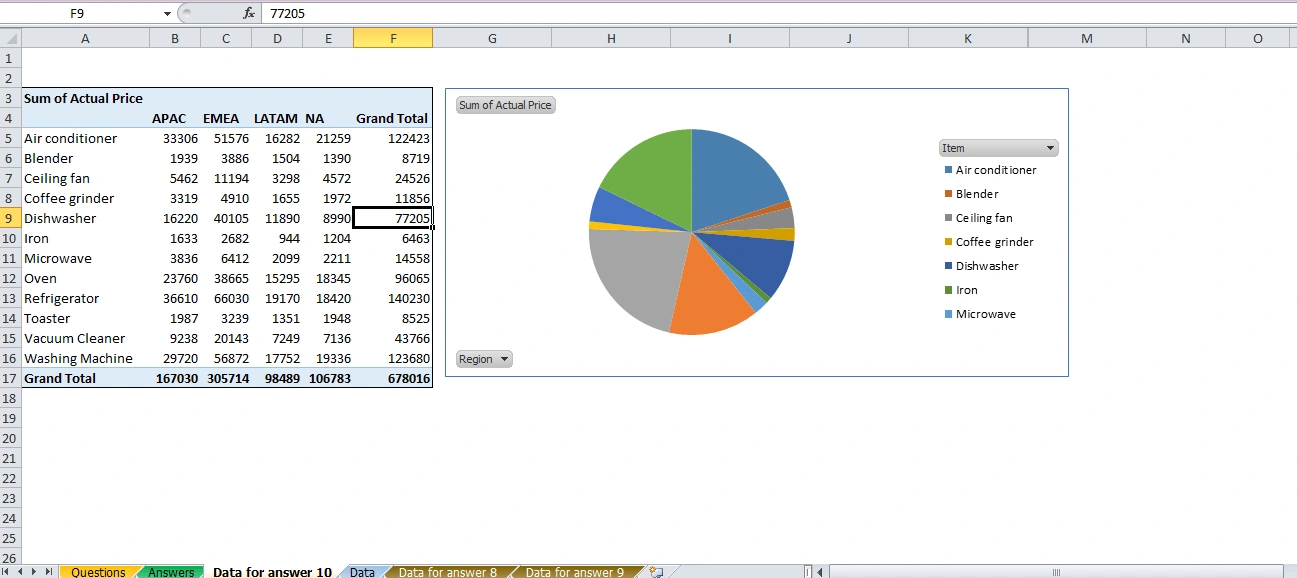
Revenue Breakdown by Item and Region
Conclusion
This project provides a robust framework for data analysis and visualisation using Excel. The insights gained from this analysis can significantly enhance business decision-making processes, optimise sales strategies, and ultimately improve overall performance. By presenting complex data in an easy-to-understand format, this project demonstrates the power of Excel in transforming raw data into valuable business intelligence.
Thank you for visiting my profile! If you have any questions, need further information, or wish to discuss a project, I am here to help. My expertise in Excel data analysis, including Pivot Tables, charts, and detailed reporting, is at your service. I am committed to delivering high-quality and insightful analysis tailored to your business needs.
Feel free to reach out to me directly via the contact options provided on this platform. I look forward to the opportunity to collaborate with you and help drive your business success.
Like this project
Posted May 26, 2024
As a skilled data analyst, I successfully tackled a comprehensive analysis project for a multinational home appliances retailer.
Likes
0
Views
41