The network for creativity
Join 1.25M professional creatives like you
Connect with clients, get discovered, and run your business 100% commission-free
Creatives on Contra have earned over $150M and we are just getting started
Back to feedPost
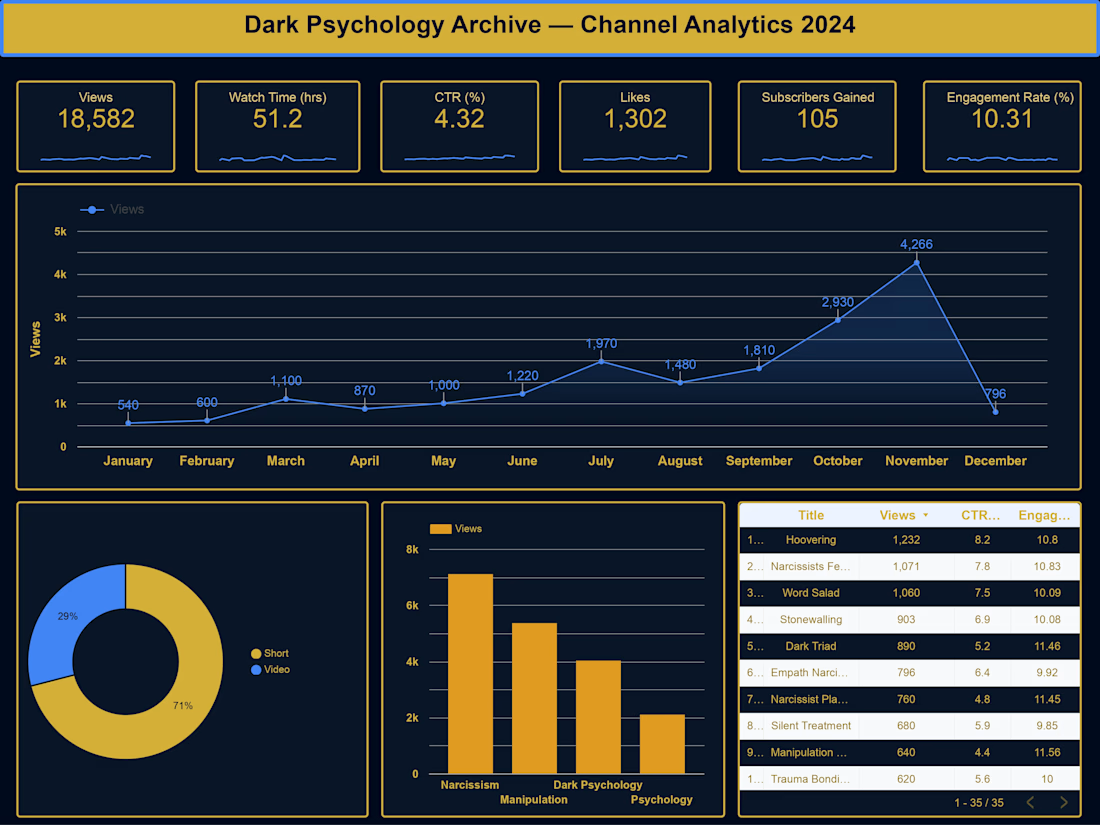
Built a full YouTube analytics dashboard in Google Looker Studio using real channel data from Dark Psychology Archive.
The dashboard tracks 6 KPIs — Views (18,582), Watch Time (51.2 hrs), CTR (4.32%), Likes (1,302), Subscribers Gained (105), and Engagement Rate (10.31%). A monthly trend line reveals the growth curve peaking at 4,266 views in November. Content-type breakdown shows Shorts drive 71% of total views. Top performer: Hoovering at 1,232 views with 8.2% CTR.
Built to help content creators make data-driven decisions on what to post, when, and in what format — without exporting CSVs manually.
The network for creativity
Join 1.25M professional creatives like you
Connect with clients, get discovered, and run your business 100% commission-free
Creatives on Contra have earned over $150M and we are just getting started
Related posts
5K likes didn't happen overnight. It came from showing up, experimenting, learning, and staying consistent. Every milestone is proof that small efforts add up over time.
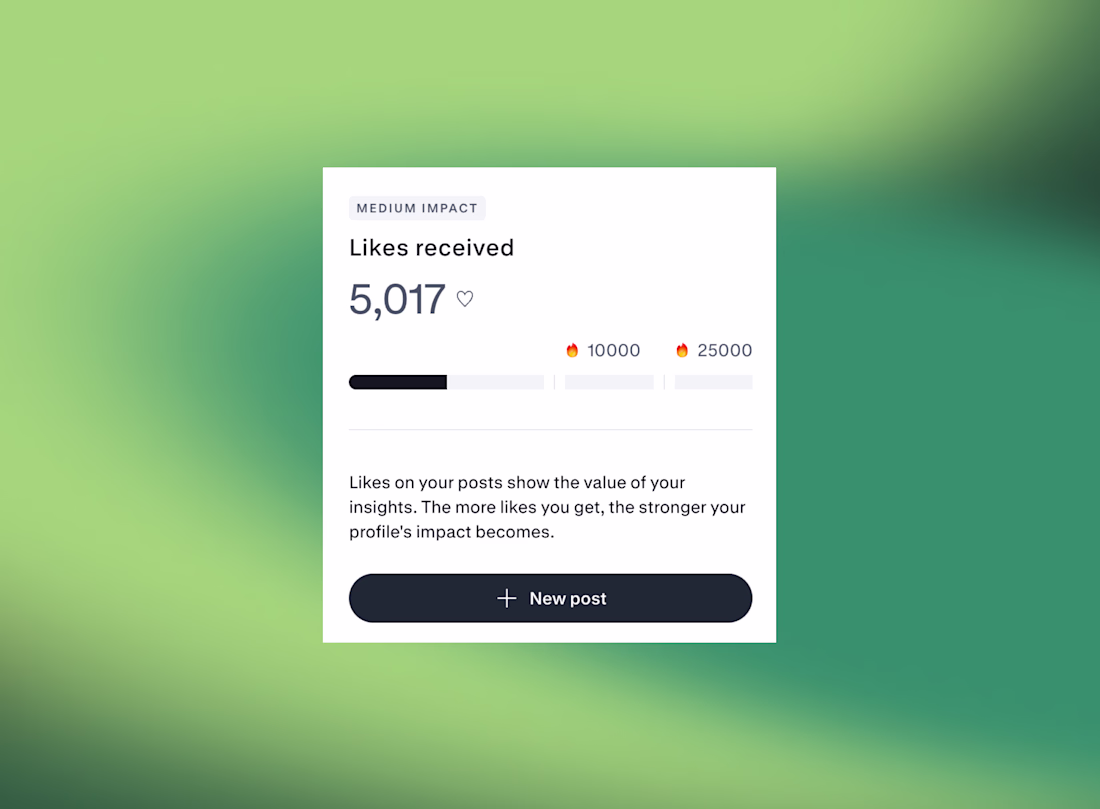
congratulations
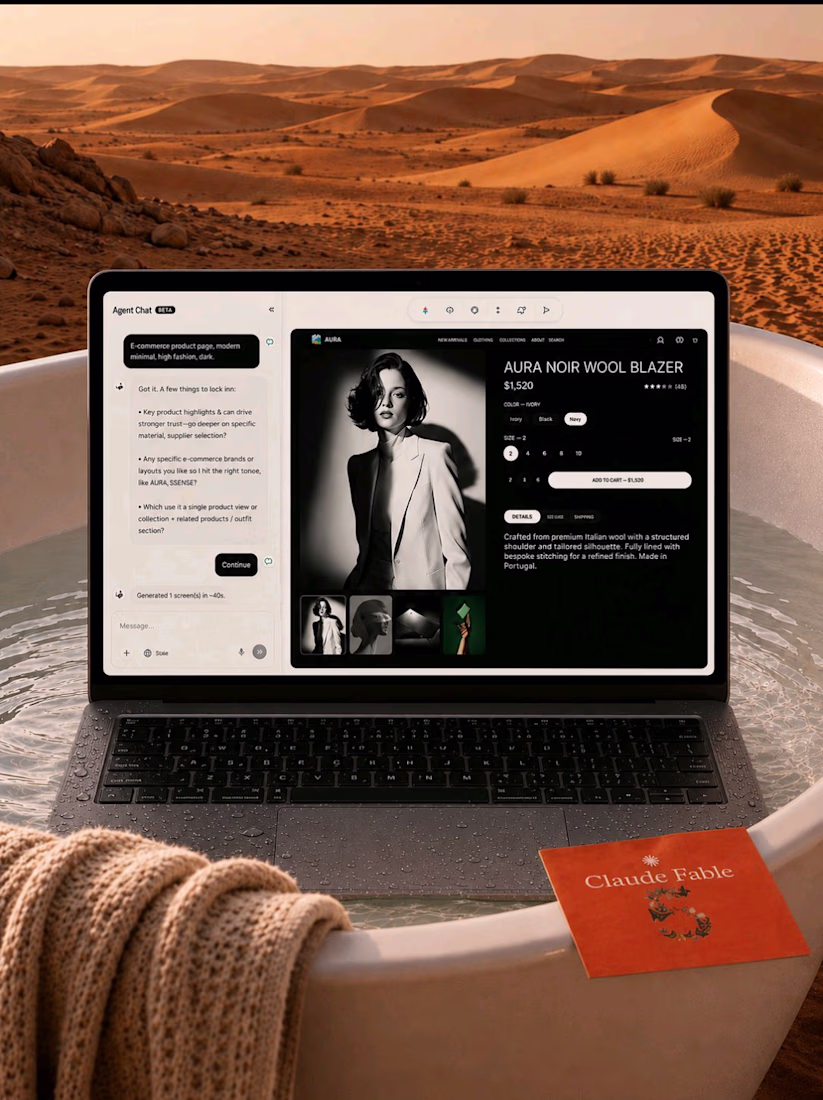
Everyone says AI will replace designers.
I think AI will replace boring work.
Designers who understand users, products, and visual storytelling will become even more valuable.
AI is my teammate.
Taste is still my superpower
That's how I design products—and that's the direction we're building with Inspo AI.
#UIUX #ProductDesign #ArtificialIntelligence #BuildInPublic #Contra #Startup
Title:
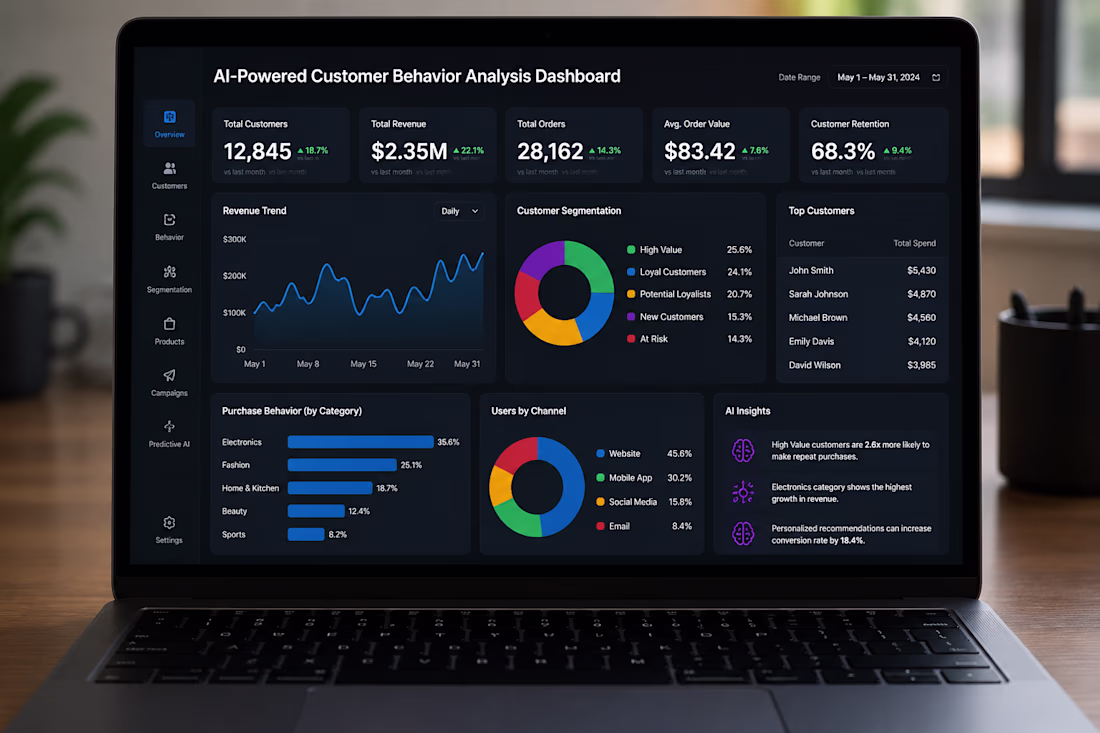
📊 AI-Powered Customer Behavior Analysis Dashboard
Description:
Built an interactive Business Intelligence dashboard to analyze customer behavior, sales performance, customer segmentation, revenue trends, KPIs, and AI-driven business insights using Excel, SQL, Power BI, and Tableau.
Trending
Claude
Claude has entered the design space. How are you using Claude Design?
Contra University
Learn from expert creatives how to earn more using next-gen AI tools.
creativeaiflow
Creative AI workflows are evolving. What tools do you use, and what are their strengths and weaknesses?
freelancerlife
Freelancer life is wins, pivots, and everything in between. What’s yours right now?