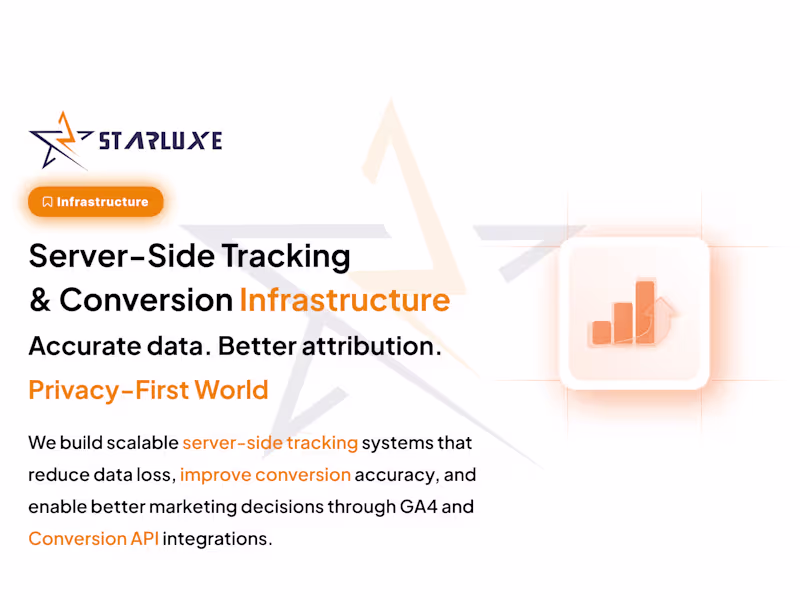
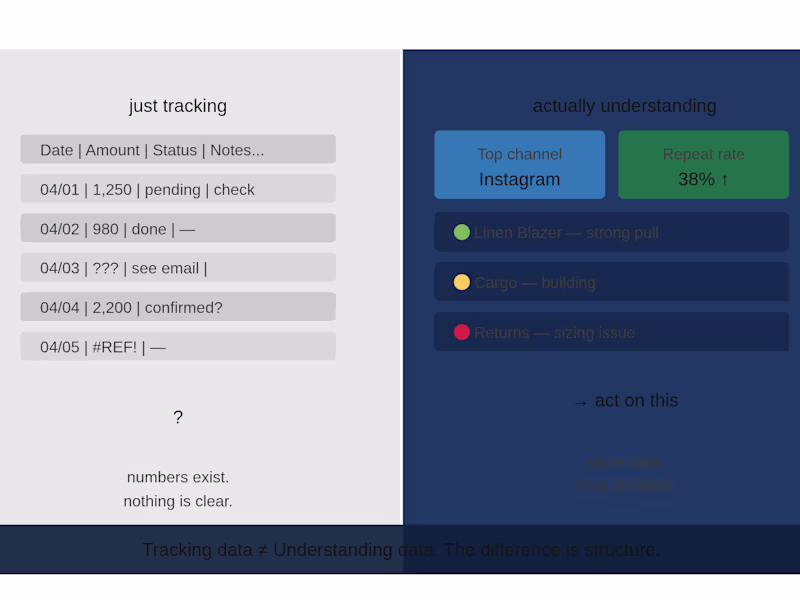
Analytics Specialist and Data Visualizer
- $1k+
- Earned
- 3x
- Hired
- 5.0
- Rating
- 34
- Followers
Analytics Specialist and Data Visualizer
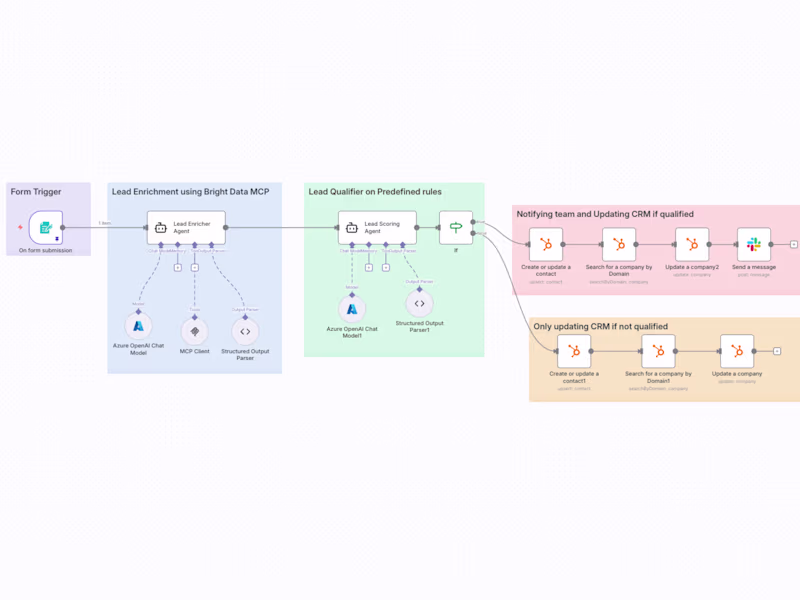
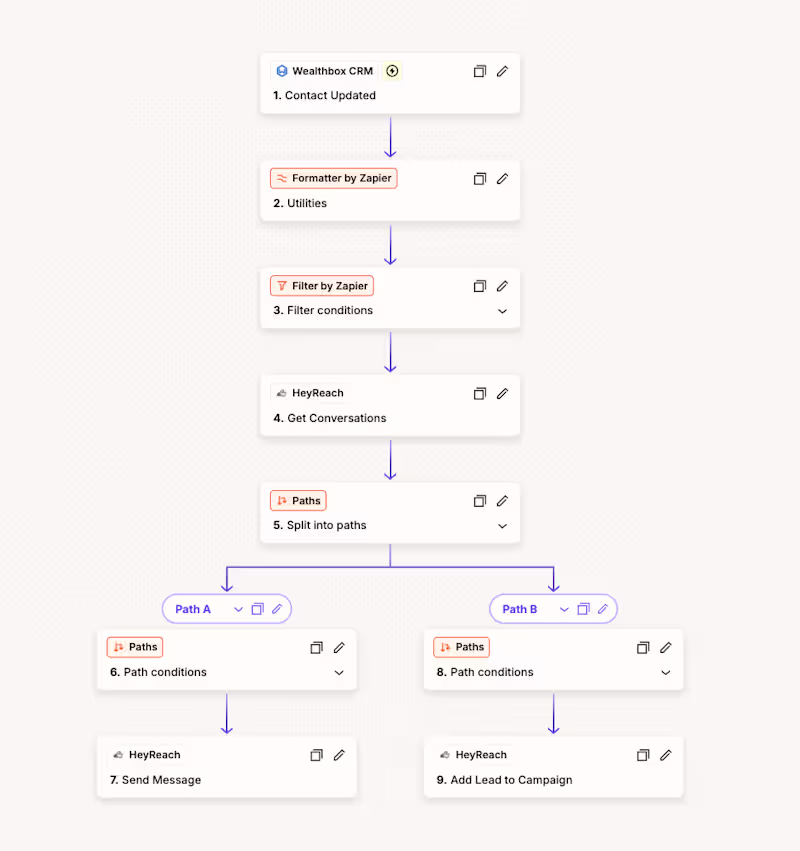
Helping B2B businesses unlock growth with AI & Automations
- $5k+
- Earned
- 5x
- Hired
- 5.0
- Rating
- 15
- Followers
Helping B2B businesses unlock growth with AI & Automations
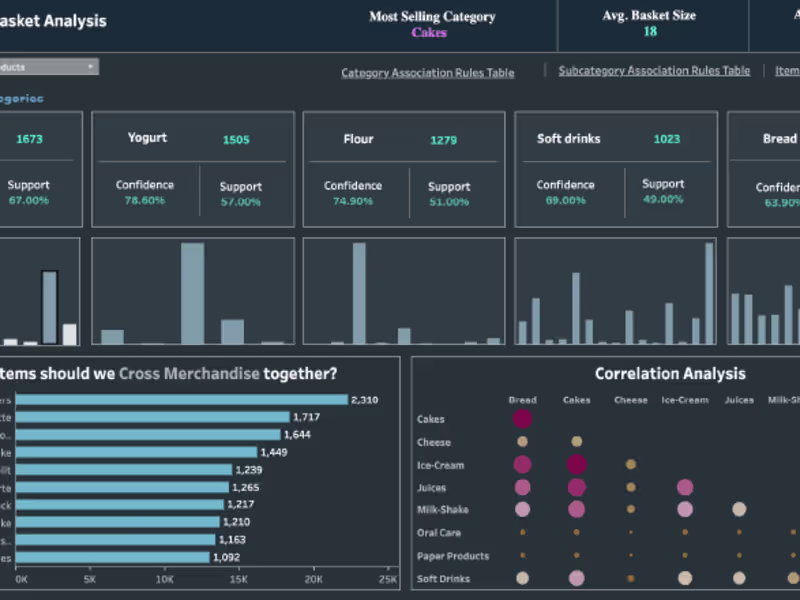
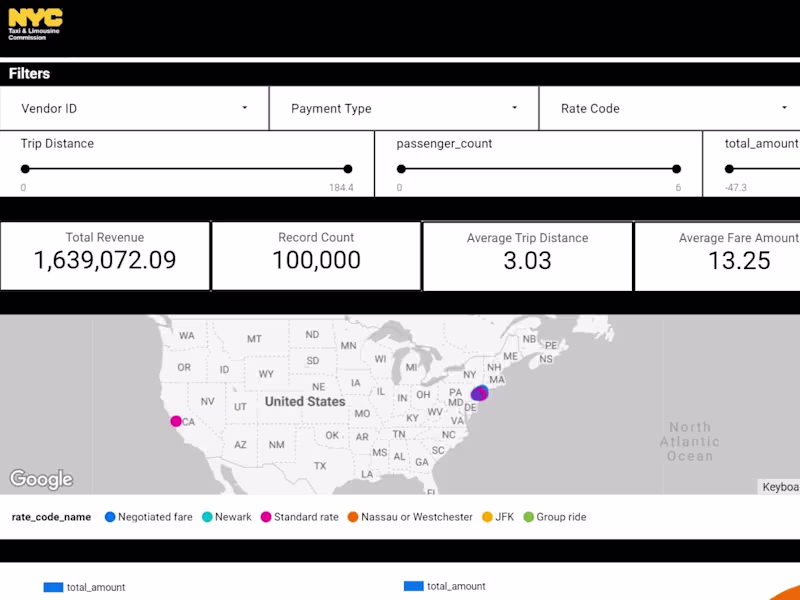
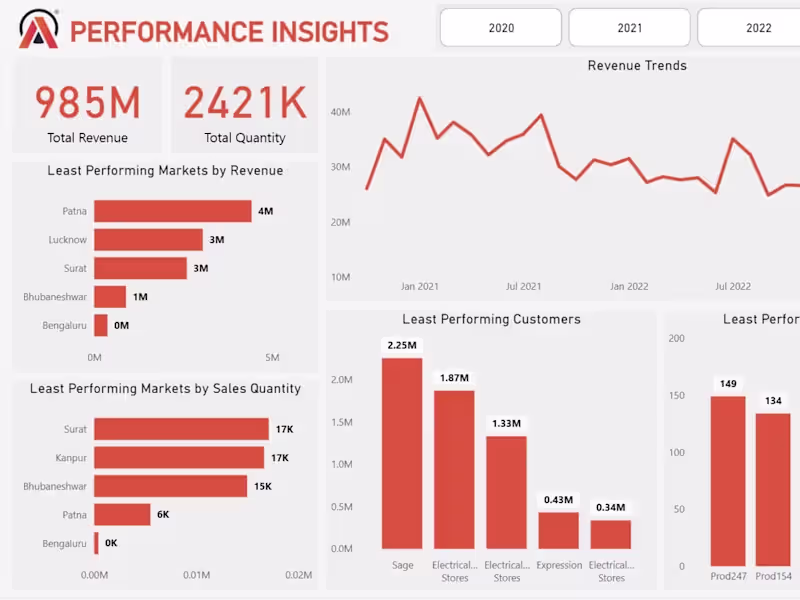
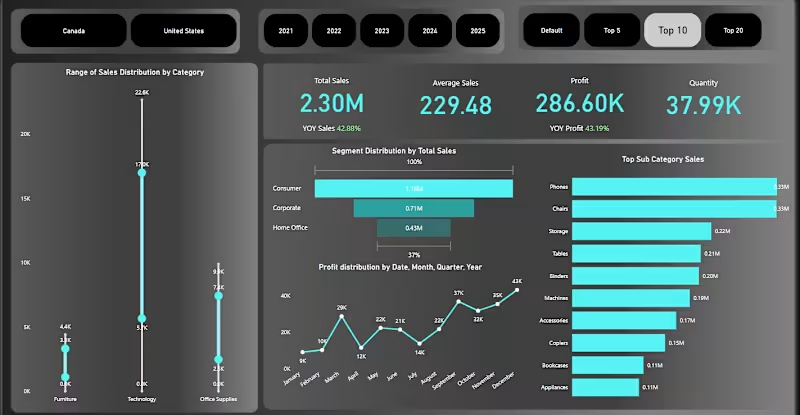
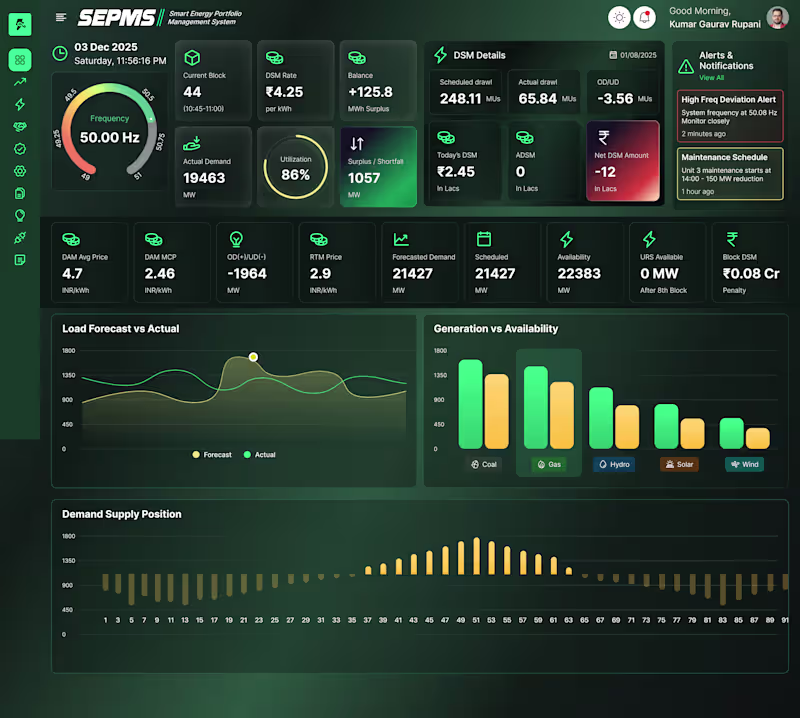
Data Analyst | SQL, PowerBI, Tableau, Python
Data Analyst | SQL, PowerBI, Tableau, Python

View more →
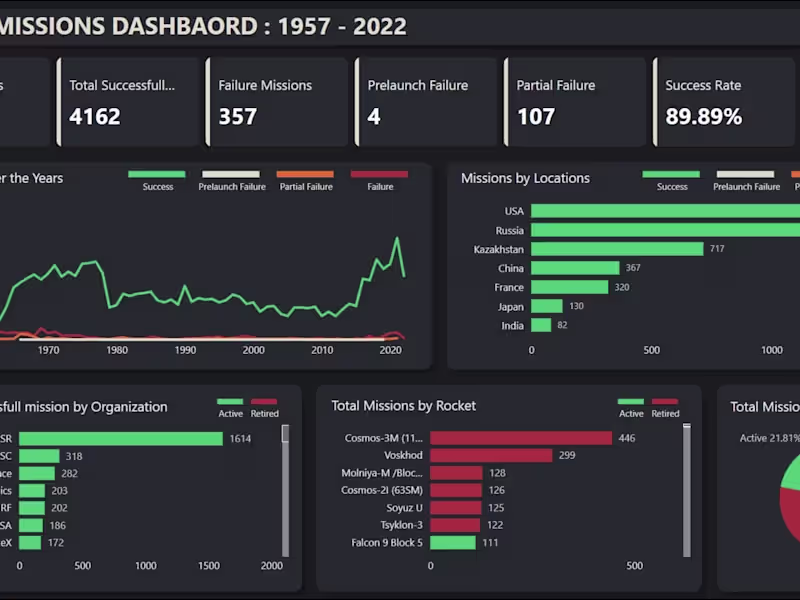
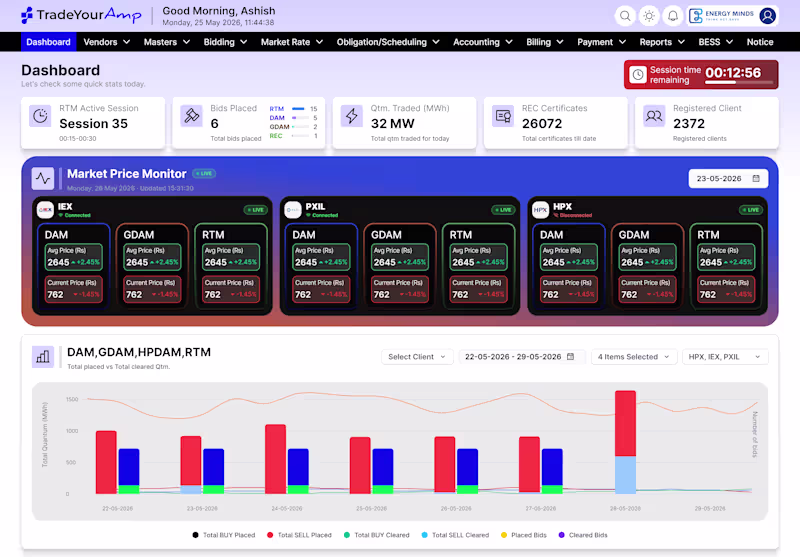
Data Insights & Stunning Visuals Expert
Data Insights & Stunning Visuals Expert

View more →
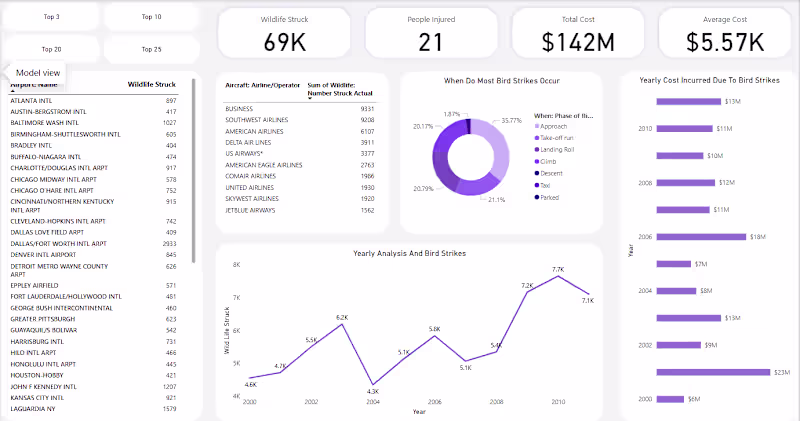
I provide data visualization solution in Power BI.
I provide data visualization solution in Power BI.
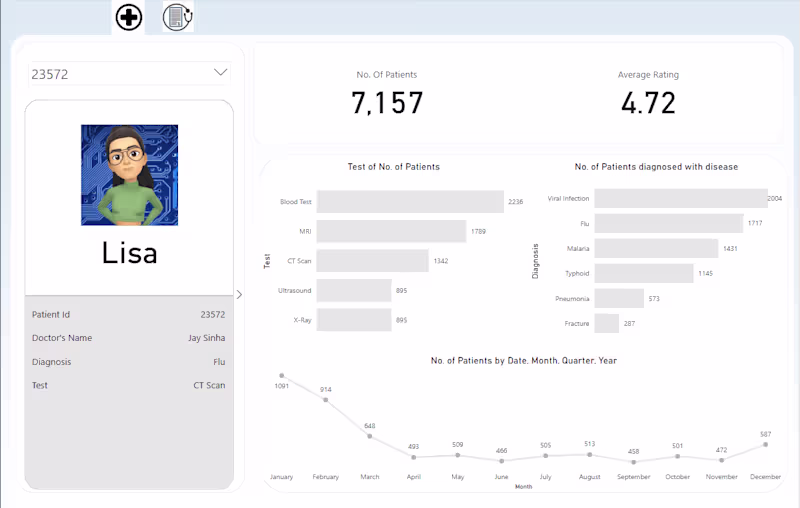
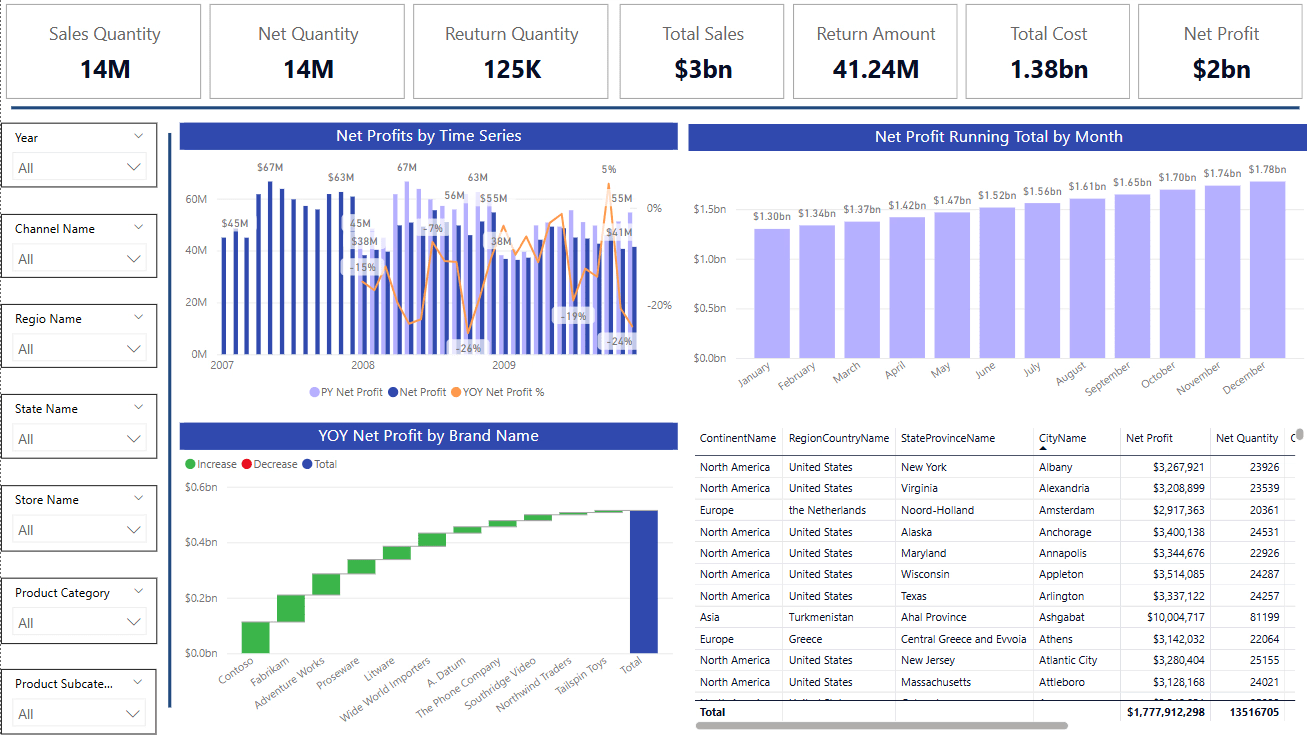
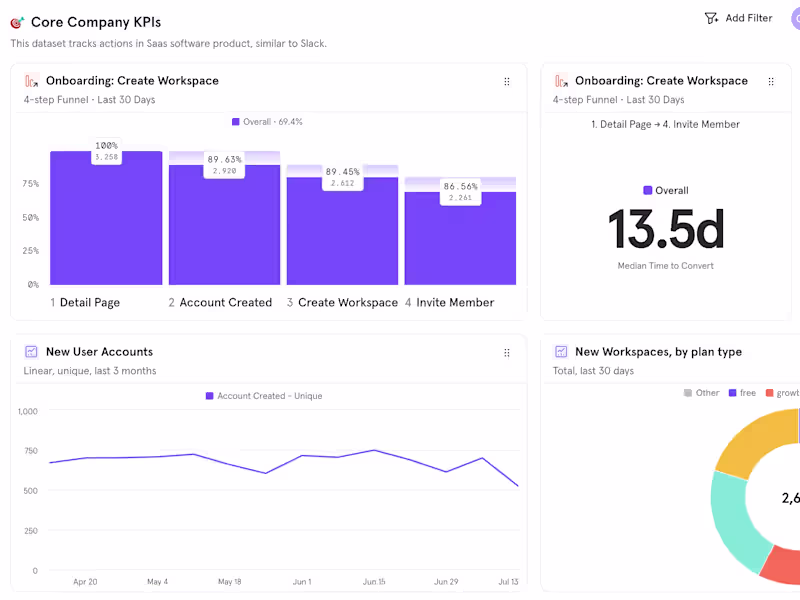
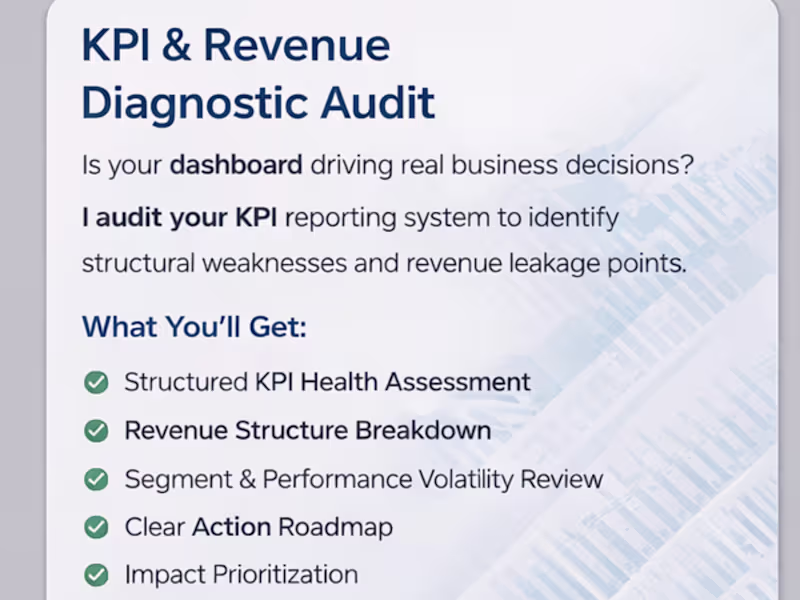
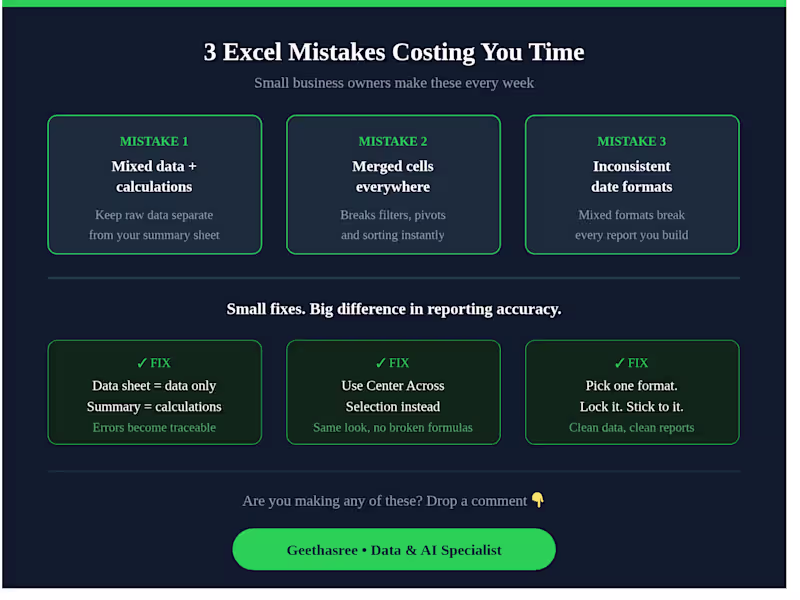
Excel & KPI Dashboards for Small Business Decisions
- 93
- Followers
Excel & KPI Dashboards for Small Business Decisions
Full-Stack Web & Mobile App Expert | UI/UX

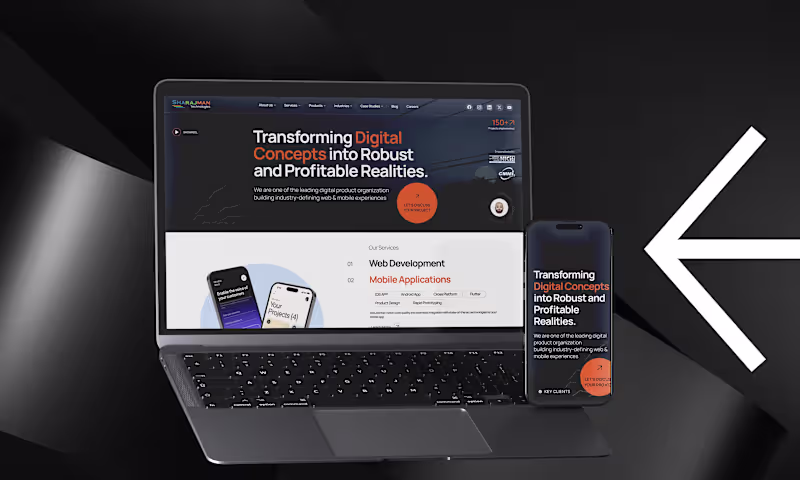
Developer building whatever you imagine into reality.