The network for creativity
Join 1.25M professional creatives like you
Connect with clients, get discovered, and run your business 100% commission-free
Creatives on Contra have earned over $150M and we are just getting started
Back to feedPost
Most dashboards don’t have a visualization problem.
They have a KPI problem.
I’ve reviewed dozens of reporting systems recently and the pattern is consistent:
Metrics are defined differently across sheets
“Revenue” means one thing in finance and another in marketing
KPIs are tracked… but not tied to decisions
Dashboards look clean but don’t answer operational questions
When metric logic isn’t aligned, teams don’t have a data problem.
They have a decision problem.
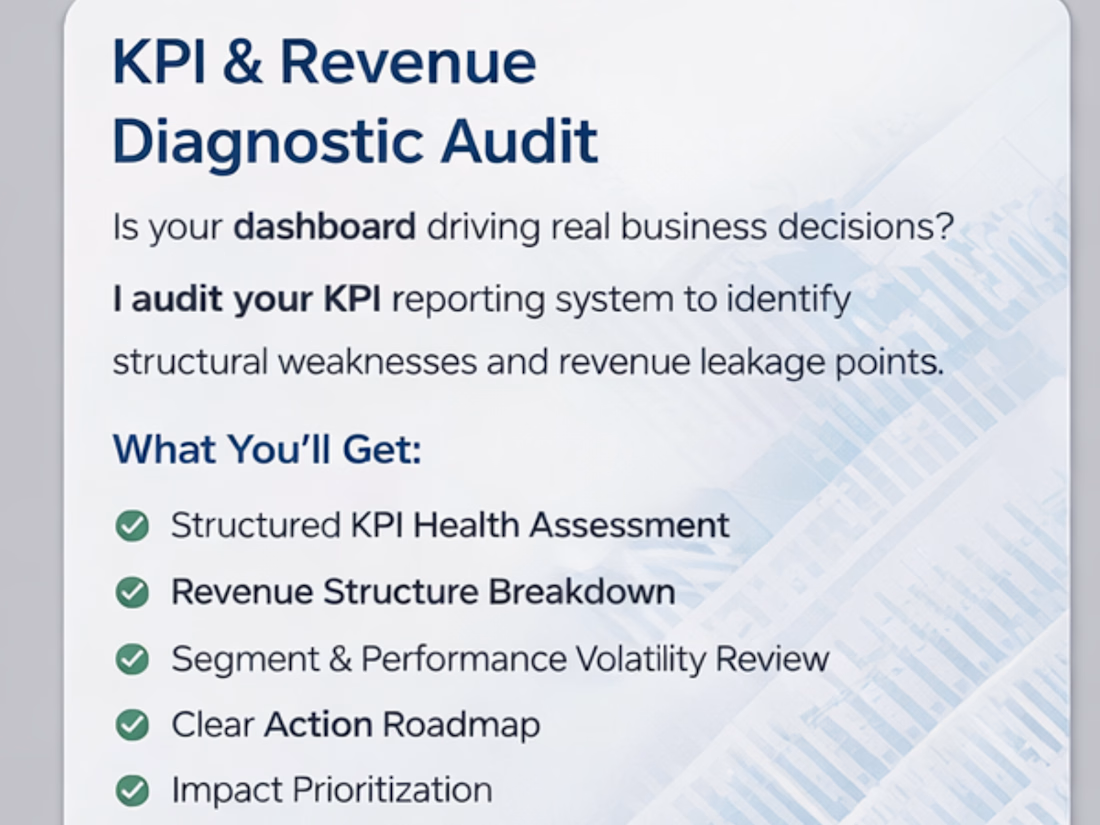
That’s why I’ve started offering a structured KPI & Revenue Diagnostic Audit — focused on:
• Metric consistency
• Reporting logic
• Revenue driver alignment
• Decision-readiness
If you're building dashboards or scaling reporting systems, this layer matters more than design.
exceldataanalyticsMicrosoft ExcelexceldashboardData AnalysisData VisualizationProduct Data AnalyticsGoogle SheetsMicrosoft Word
Completely agree. Most dashboards optimize for visuals, not decision velocity. If KPIs aren’t standardized across teams, you’re basically scaling confusion. The real leverage is in metric governance before visualization.
Exactly. Visualization should reduce friction, not decorate inconsistency.
If two teams calculate “active customer” differently, no chart will fix the downstream decisions.
Standard definitions + update logic > prettier dashboards.
Most reporting problems are governance problems in disguise.
Completely agree. When metric definitions drift, dashboards just amplify the confusion.
Alignment on semantics and update logic is usually the real leverage point — everything downstream becomes cleaner once that’s standardized.
Exactly. Once definitions are locked, reporting shifts from interpretation debates to performance conversations.
I’ve noticed most “data issues” disappear when teams document metric logic alongside ownership and refresh cadence. Clarity upstream removes noise downstream.
You’re absolutely right, Geethasree.
In my experience, most KPI misalignment isn’t just a reporting issue —
it becomes a capital signaling issue.
When “revenue” means different things across teams,
capital often gets allocated based on perception rather than structure.
That’s...
That’s a sharp way to frame it — capital signaling is where KPI misalignment becomes expensive.
When revenue, margin, or cohort value aren’t structurally defined, allocation follows narrative instead of economics.
Dashboards aren’t just reporting layers — they’re decision...
KPI matters a lot than anything else
The network for creativity
Join 1.25M professional creatives like you
Connect with clients, get discovered, and run your business 100% commission-free
Creatives on Contra have earned over $150M and we are just getting started
Related posts
Most companies know their revenue.
Very few know where their profit actually comes from.
That gap is expensive.
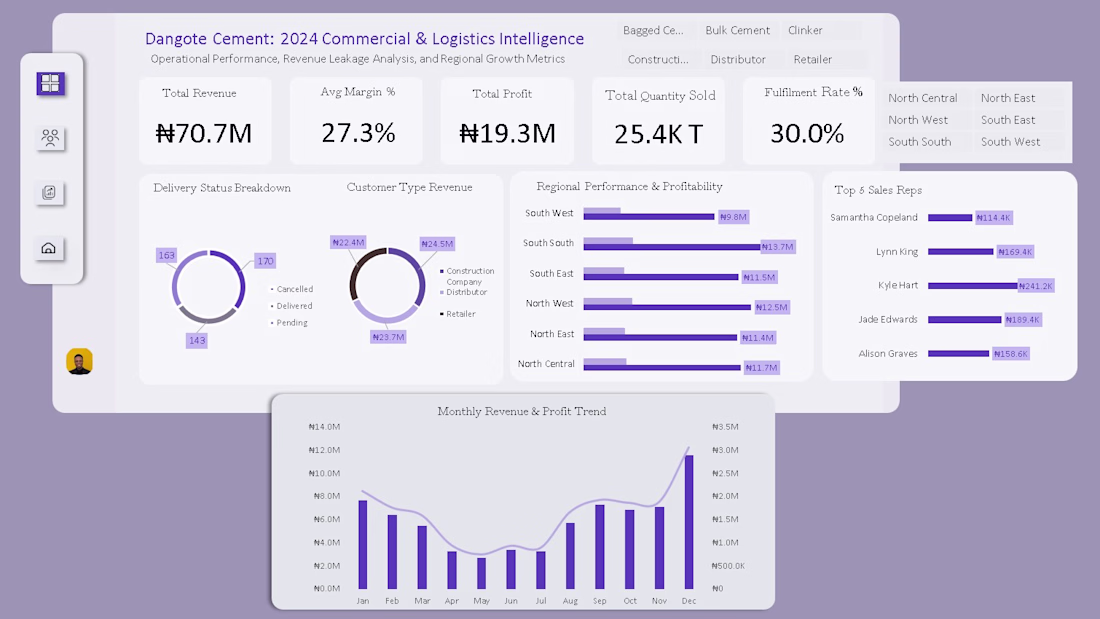
I recently analyzed a commercial & logistics dataset for a cement company and what I found underneath the surface numbers was the kind of insight that changes how a business makes decisions.
Here's the headline:
→ ₦70.7M total revenue
→ ₦19.3M total profit
→ 27.3% average profit margin
Clean numbers. But the real story started when I broke them down 👇
📍 Regional Profitability
The South South region didn't just generate revenue, it led in profitability. Not every region performs equally and treating them like they do is a costly assumption.
🧑🤝🧑 Customer Segment Analysis
Retail vs. Distributor customers showed clear differences in revenue contribution. Segment level visibility changes how you price, prioritize, and grow.
🚚 Delivery & Operational Efficiency
Deals were closing but delivery gaps were quietly leaking value before products even reached customers. Operational blind spots don't show up in revenue reports. They show up in margins.
🏅 Sales Rep Performance
A concentrated group of top performers was driving a disproportionate share of results. That's a talent insight, a succession risk, and a coaching opportunity all in one.
Reporting revenue is easy. Understanding what's driving it and what's quietly eroding it is where real business intelligence lives. That's the difference between a dashboard and a decision.
🛠️ Built with Microsoft Excel, Pivot Tables, Data Modelling, Dashboard Design
This is the kind of work I'm building my practice around:
✅ Sales & business performance analytics
✅ Financial analysis & margin optimisation
✅ Logistics, supply chain & operational data
✅ Risk analytics & data driven decision support
If your business is sitting on sales, logistics, or financial data without a clear view of what it's telling you, that's exactly the problem I solve.
📩 Currently open to Data Analyst, Business Analyst, and Risk Analyst opportunities, full time, contract, or freelance. Drop a comment, send a DM, or follow along. More projects like this coming soon.
#DataAnalytics #BusinessIntelligence #ExcelDashboard #SalesAnalytics #LogisticsData #FinancialAnalytics #ProfitabilityAnalysis #DataDriven #RiskAnalytics #OpenToWork #DataAnalyst #BusinessAnalyst #AnalyticsPortfolio #OperationalEfficiency #DataStorytelling
Fraud doesn’t always look suspicious, until you analyse the patterns.
I recently worked on a Vehicle Insurance Claim Fraud Analysis case study where the goal was simple:
👉 identify hidden risk signals and process gaps that allow fraudulent claims to slip through.
🔍 The problem
Insurance teams deal with thousands of claims, but:
• Fraud is often buried inside normal-looking transactions
• Manual checks miss systemic weaknesses, not just bad actors
• High-risk signals are rarely quantified clearly
So I approached this as a real-world fraud analyst, not just a dashboard exercise.
🛠️ What I did (end-to-end)
Using Excel analysis, I:
• Cleaned and structured claim-level data
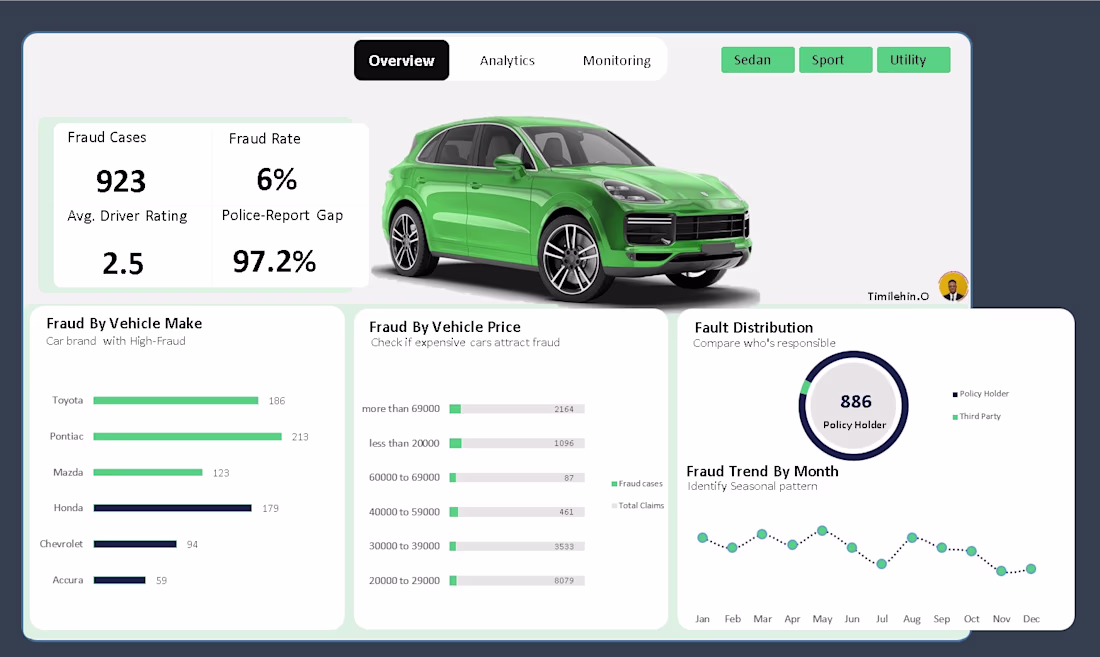
• Defined fraud-focused KPIs, not vanity metrics
• Built an interactive dashboard with slicers to simulate decision-making
📊 Core KPIs tracked
• Fraud Rate (%)
• Total Fraud Cases
• Average Driver Risk Rating (Fraud)
• Police Report Gap (%) - fraud claims filed without police reports
🚨 Key insights discovered
• Fraud concentration varied strongly by vehicle price band, not just volume
• Certain vehicle categories consistently showed higher fraud exposure
• An alarming 97%+ of fraudulent claims lacked police reports, highlighting a major verification gap
• Driver risk ratings provided early signals that could support preventive controls
These insights aren’t theoretical, they point directly to where insurers are leaking money.
💡 Business impact (how this helps)
This type of analysis helps organisations:
• Flag high-risk claims earlier
• Strengthen fraud prevention rules
• Improve compliance and documentation checks
• Reduce payout losses without increasing manual workload
🧠 Tools & skills applied
Excel (Advanced Pivot Analysis)
Fraud & Risk Analytics
Dashboard Storytelling
Business Intelligence Thinking
I’m building and sharing real fraud analytics case studies as I continue to grow in this space, focusing on credit card, insurance, and transaction fraud.
If you’re a:
• Fraud / Risk Manager
• Insurance or FinTech team
• Founder needing data-driven fraud insights
I’m open to conversations and collaboration.
#FraudAnalytics #FraudDetection #RiskAnalytics #BusinessIntelligence #ExcelDashboard #DataAnalytics #BuildInPublic
wow this is very insightful
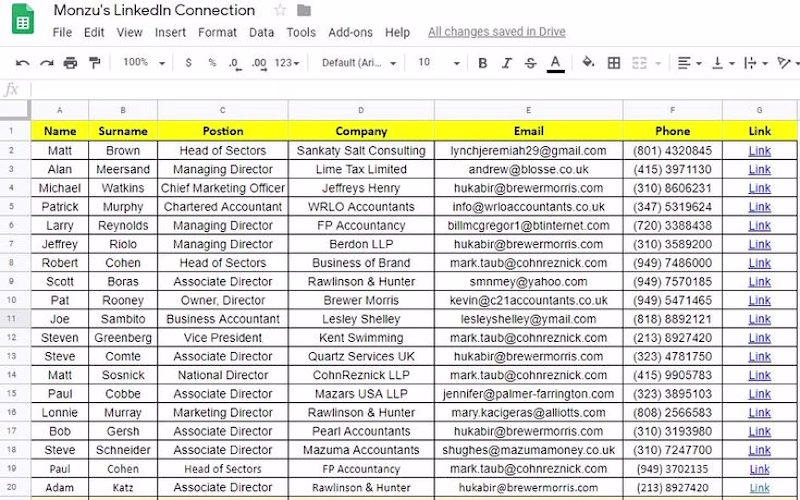
The client was an outreach-driven professional , either in sales, recruitment, or B2B consulting ... who had built up a substantial LinkedIn network over time but had no organized way to leverage it. Their connections existed only inside LinkedIn's ecosystem, making it impossible to run targeted email campaigns, segment contacts by industry or seniority, or feed prospects into a CRM or outreach tool. Every time they needed to reach out to a specific type of contact ... say, Managing Directors at accounting firms ... they had to manually scroll through their connections one by one. There was no master list, no exportable data, and no way to filter by job title, company, or sector. They were sitting on a goldmine of warm contacts with no infrastructure to mine it.
I extracted, cleaned, and organized the client's full LinkedIn connections data into a structured Google Sheets database with seven clearly labeled columns ... First Name, Surname, Job Title, Company, Email, Phone Number, and a direct LinkedIn Profile Link. Every row was verified and formatted consistently so the data was immediately usable for outreach, CRM import, or campaign segmentation. The spreadsheet covered a diverse range of decision-makers including Managing Directors, Chief Marketing Officers, Head of Sectors, Vice Presidents, Associate Directors, and Business Accountants ... spanning industries from accountancy and consulting to brand management and financial services. Each contact's LinkedIn profile link was embedded directly in the sheet for one-click access, making it easy to personalize outreach before sending. The final deliverable was a clean, filterable, ready-to-use lead database the client could plug straight into any email tool, CRM, or outreach sequence.
The delivered spreadsheet gave the client instant access to a fully organized, actionable contact database that had previously been locked inside LinkedIn's interface. What once required hours of manual searching and copy-pasting was now a single, filterable file the client could sort by job title, company, or industry in seconds. The structured format meant the data could be imported directly into tools like GoHighLevel, HubSpot, Apollo, or Instantly without any reformatting. The client was able to immediately launch targeted email and LinkedIn outreach campaigns to specific segments ... for example, filtering only Managing Directors in the accounting sector for a specific service pitch. By turning a passive network into an active, organized lead database, the client gained a concrete outreach asset that could generate pipeline on demand ... making every future campaign faster, more targeted, and significantly more effective.
This is such a clean breakdown of a real client problem —
the "goldmine with no infrastructure" framing is exactly
right. So many professionals have hundreds of warm
connections they've never been able to act on systematically.
I do similar work — extracting, cleaning and...
Challenges
View allTrending
Claude
Claude has entered the design space. How are you using Claude Design?
Contra University
Learn from expert creatives how to earn more using next-gen AI tools.
MagicPath
The canvas is infinite, and exploration is becoming the workflow. How are you using MagicPath?
creativeaiflow
Creative AI workflows are evolving. What tools do you use, and what are their strengths and weaknesses?
freelancerlife
Freelancer life is wins, pivots, and everything in between. What’s yours right now?