
Ibrahim Fahd
Business Intelligence Architect & Analytics Consultant


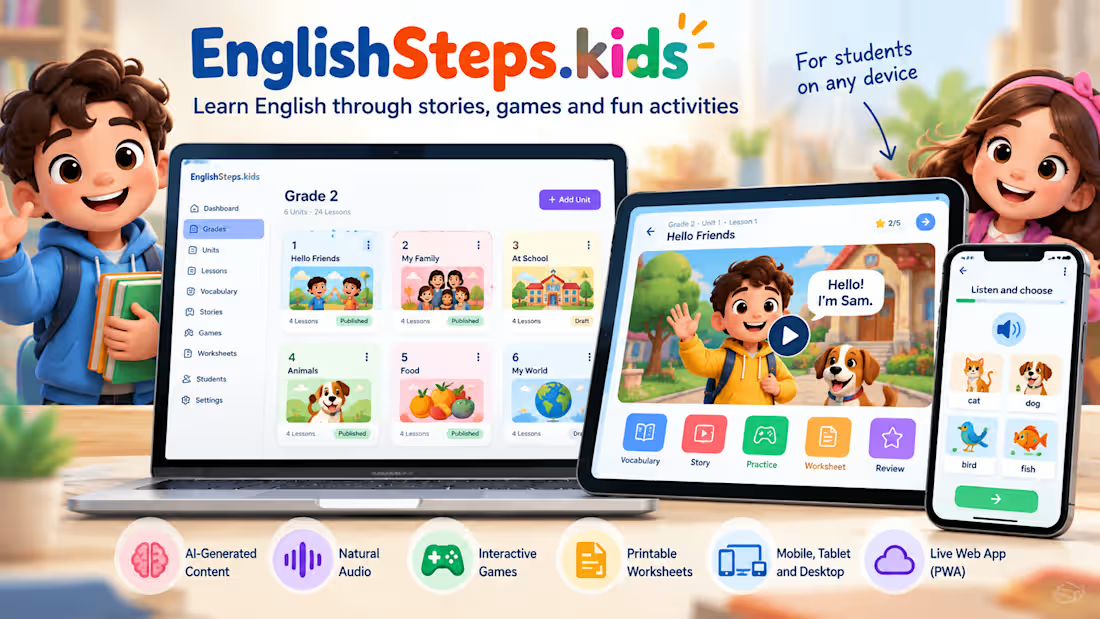
I built EnglishSteps.kids (http://EnglishSteps.kids), a teacher-first English learning platform that turns lesson ideas into complete interactive learning experiences for children.
Teachers can create structured lessons with stories, vocabulary, activities, audio, worksheets and AI-assisted visual content, while students access the lessons through a simple mobile-friendly learning experience. I also designed the workflow for recurring story characters, lesson progression and cross-device delivery so the content stays consistent and easy to use.
The main challenge was not just adding AI, but making it useful inside a real teaching workflow while keeping the teacher in control of the final lesson.
0
28
I built Lama around a simple question:
What if business intelligence behaved like a sharp, always-available employee instead of a collection of disconnected reports?
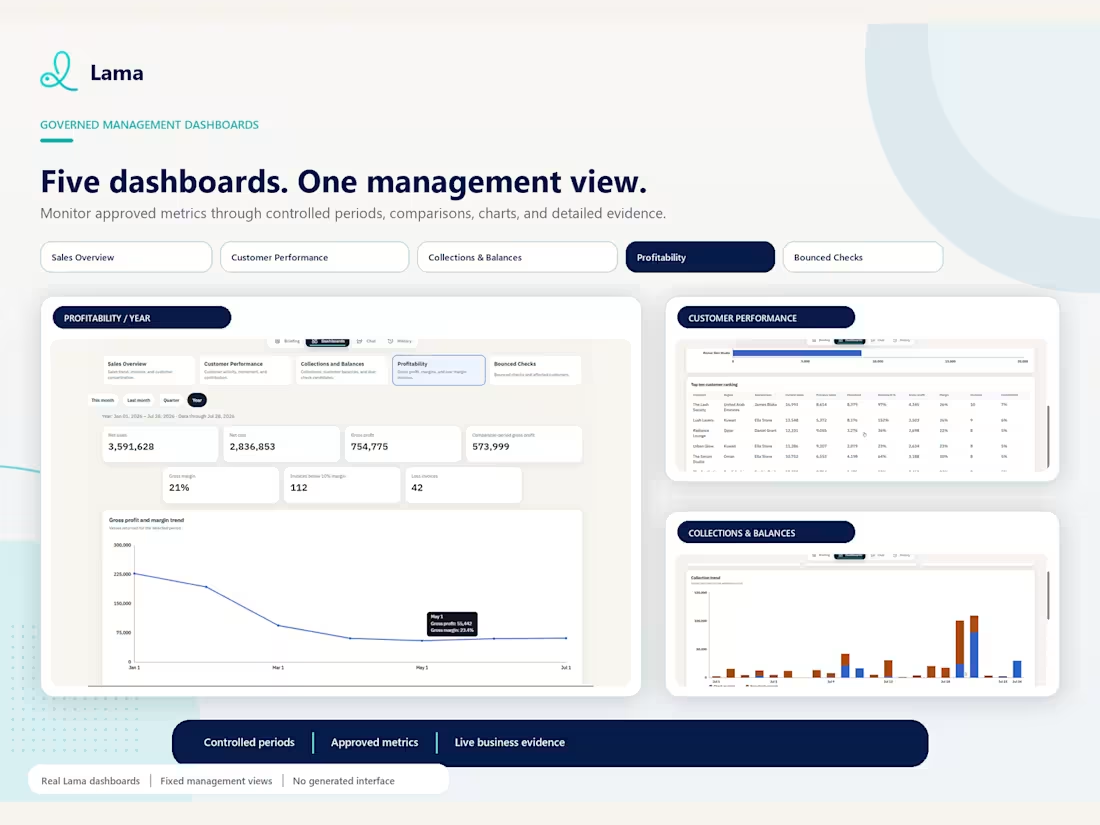
Lama brings morning briefings, context-aware conversations, governed dashboards, visual analysis, and executive reporting into one responsive experience.
She understands the metric, period, region, and grouping behind a question. She remembers the context when users follow up and returns decision-ready evidence as text, tables, charts, dashboards, or shareable reports.
The goal is simple: reduce repetitive reporting work and give decision-makers more time to stay focused on the business.
I designed the product, interaction model, responsive experience, reporting workflow, and technical architecture from end to end.
Lama is now available on my Contra profile as an AI BI discovery and implementation blueprint.
I would love to hear from BI professionals, product designers, founders, and business leaders. Where would a virtual BI employee create the most value in your organization?
#BusinessIntelligence #ArtificialIntelligence #ProductDesign
0
48
AI Analysis for Your Business
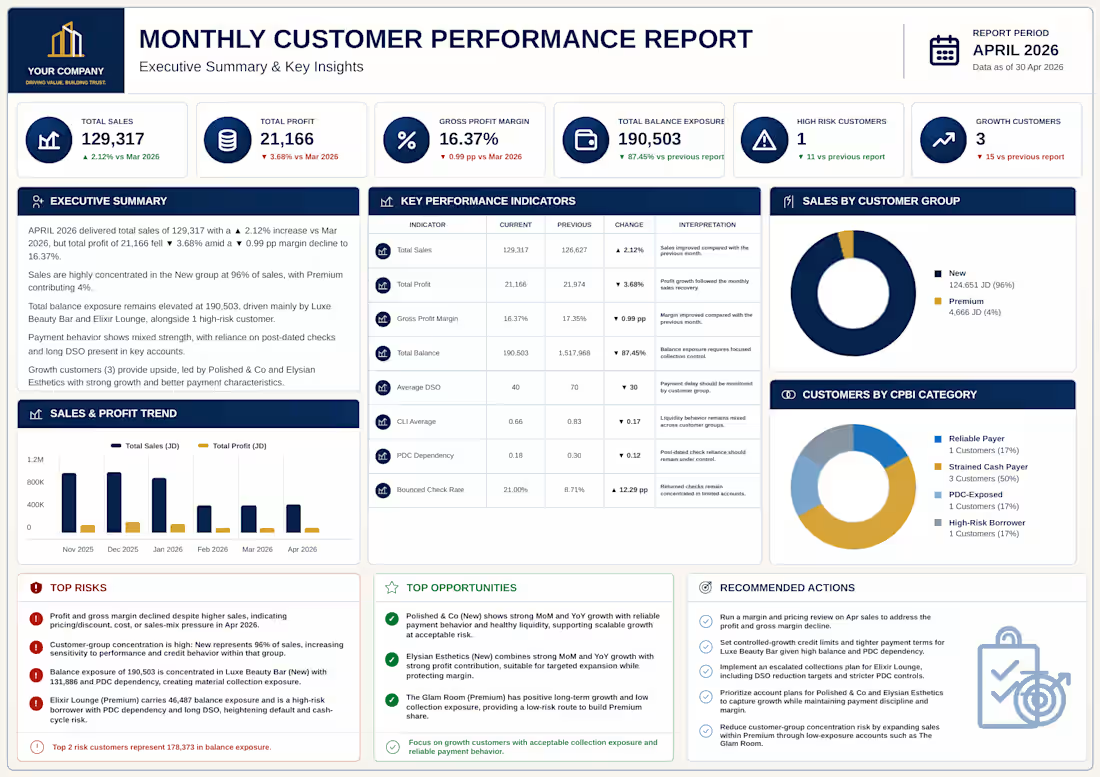
I built an automated executive reporting workflow that turns business data into a branded monthly PDF briefing with trusted KPIs, AI-assisted business analysis, and automatic delivery.
The workflow connects business data, prepares KPI logic, generates executive commentary, renders a corporate PDF report, and delivers it by email. The goal is to help companies reduce manual reporting work and give decision-makers a clear monthly view of performance, risks, opportunities, and recommended actions.
This project shows how AI can be connected to existing business data in a practical and controlled way. The numbers come from trusted reporting logic, while AI helps explain what changed, what matters, and what action should come next.
Best for businesses that already have data but want a cleaner, faster, and more consistent way to communicate insights.
0
103
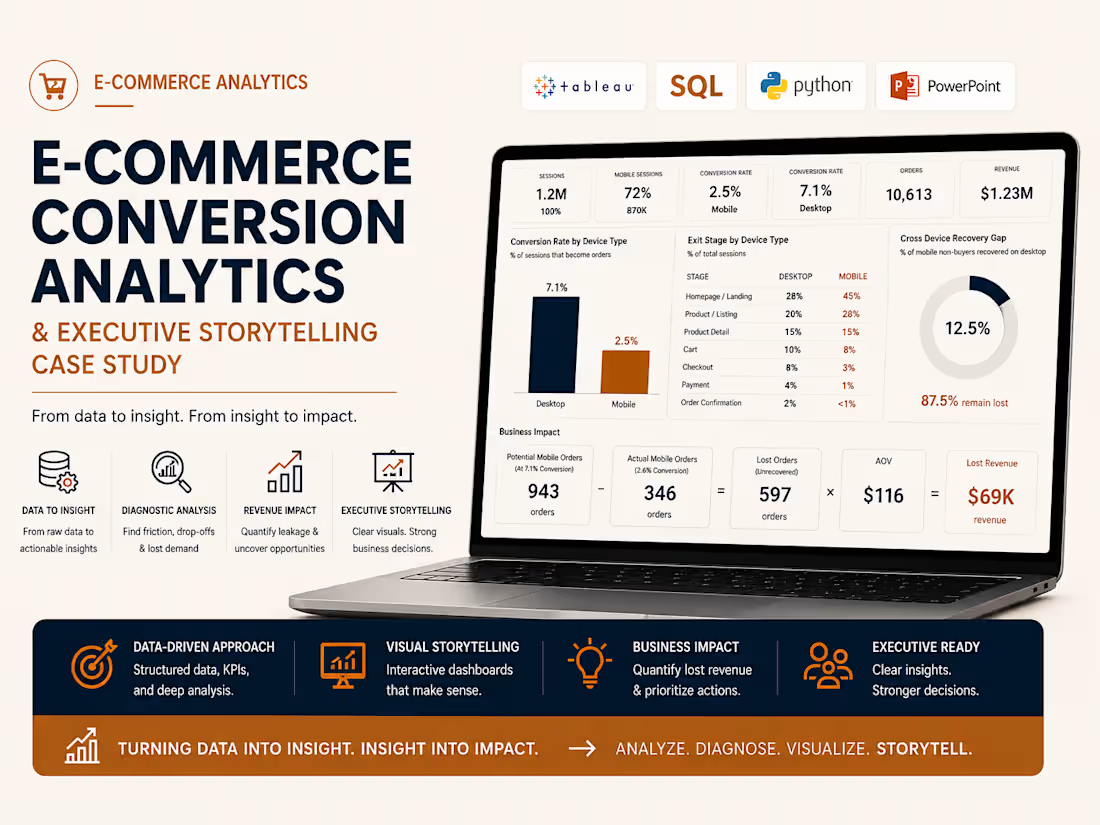
I built this e-commerce analytics case to demonstrate how data can move beyond dashboard reporting into business diagnosis and executive decision support.
The workflow covers the full analytical process:
• data acquisition and preparation
• data modeling and KPI design
• exploratory analysis
• mobile vs desktop conversion diagnosis
• cross-device recovery analysis
• revenue leakage estimation
• Tableau visualization
• executive PowerPoint storytelling
The goal was to show how analytics can identify friction, quantify business impact, and translate findings into clear recommendations.
Tools used: Python, SQL, Tableau, and PowerPoint.
Turning data into insight, and insight into business action.
0
91