
Arman Tamboli
Excel dashboard specialist turning data to dashboards
New to Contra
Arman is ready for their next project!
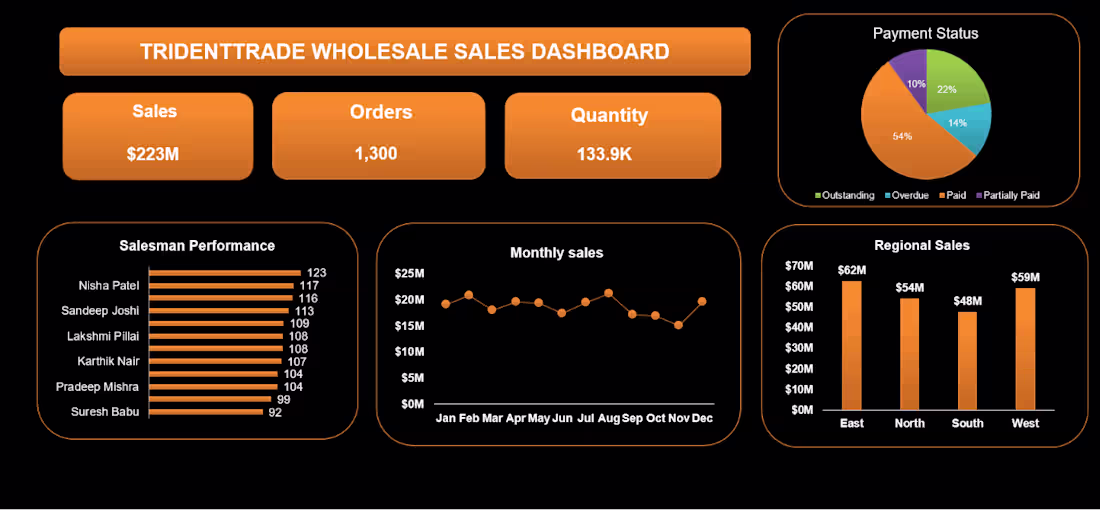
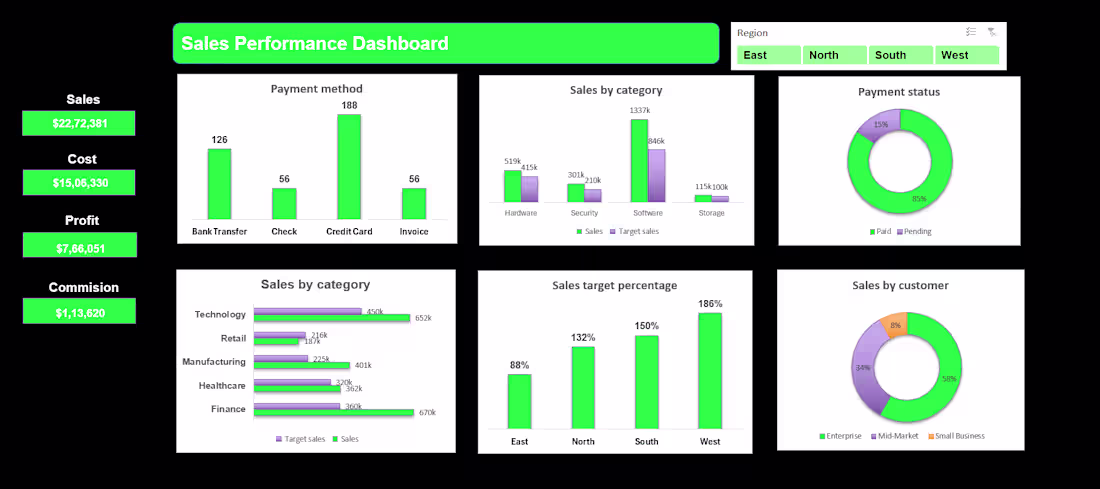
I built this dashboard to transform complex wholesale sales data into actionable intelligence.
This is exactly what it tracks:
→ Executive Snapshot: Key performance indicators (Sales, Orders, Quantity) at the top.
→ Payment Status: A real-time breakdown of outstanding, overdue, paid, and partially paid statuses to monitor cash flow.
→ Salesman Performance: A clean leaderboard to identify top contributors instantly.
→ Trend & Regional Analysis: Monthly sales velocity combined with a regional breakdown to see where the business is doing great.
The raw data behind this was massive, but looking at it would only feel it's chaos.
This dashboard turns it into a 10 second task of understanding everything.
That is the whole point not just to make something look professional, but to make it functional.
P.S. If your business is still reading raw spreadsheet data to make decisions, I would love to show you what a custom dashboard could look like for your specific numbers.
0
12

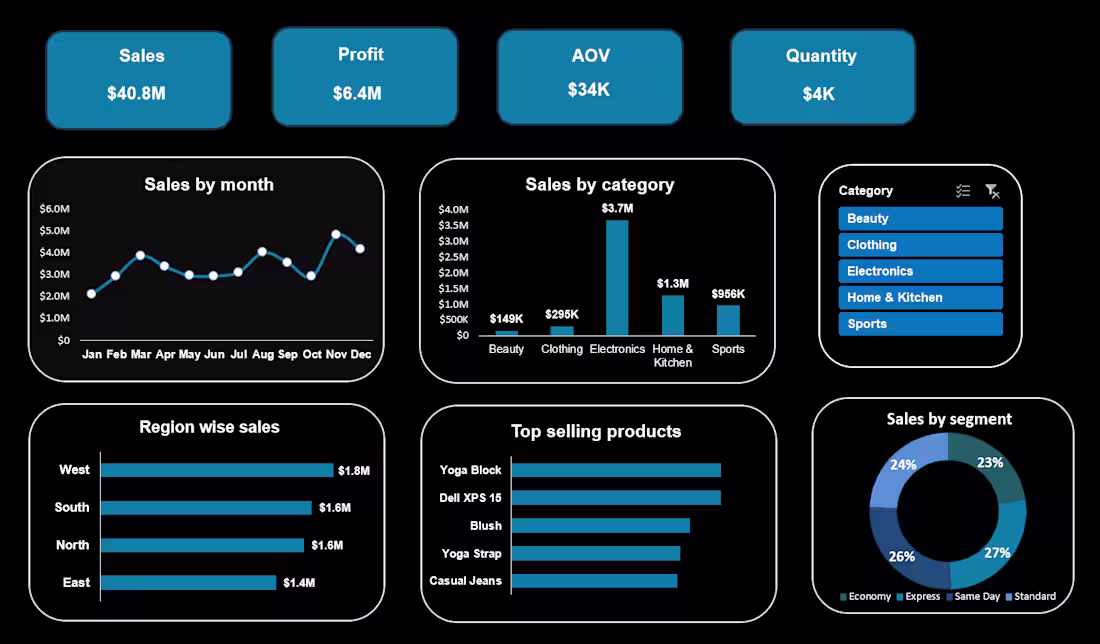
Sales Analysis Dashboard
4
6
Sales dashboard for client
2
5
163

SaaS revenue analysis Dashboard
4
3
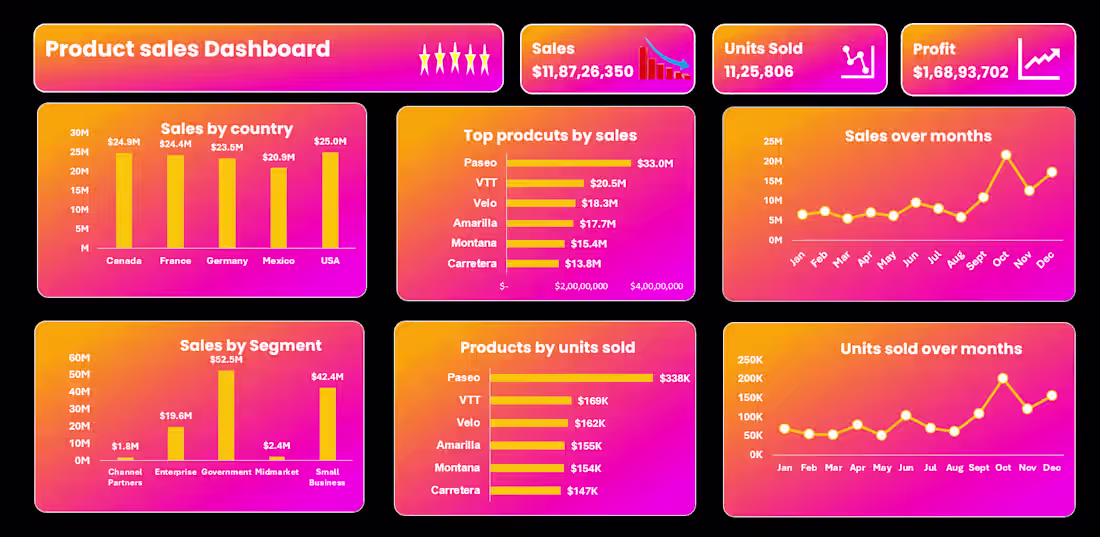
Product Sales Analysis Dashboard
4
163
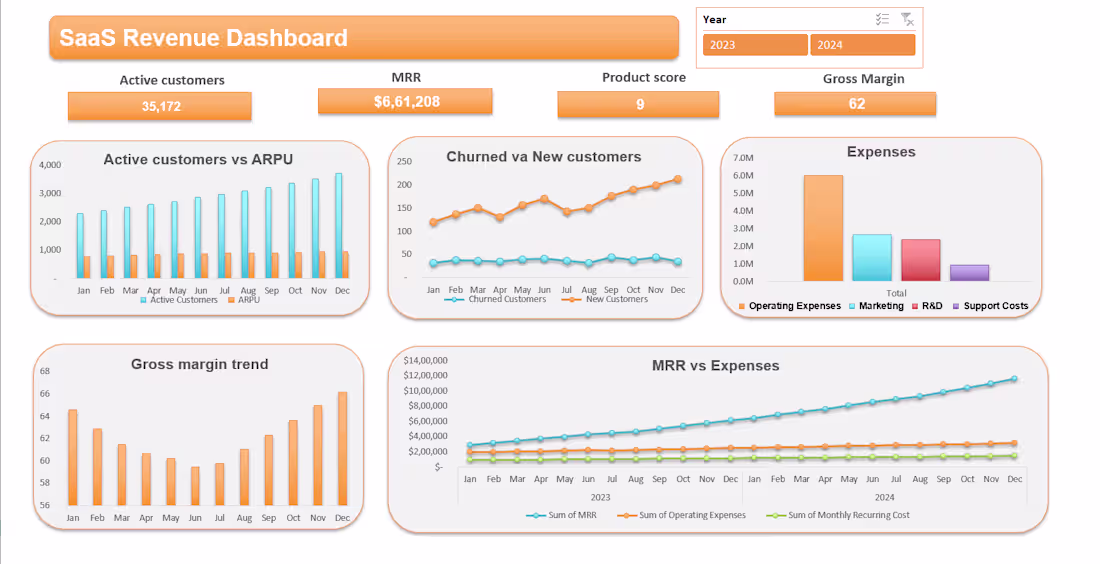
SaaS revenue analysis Dashboard
3
156
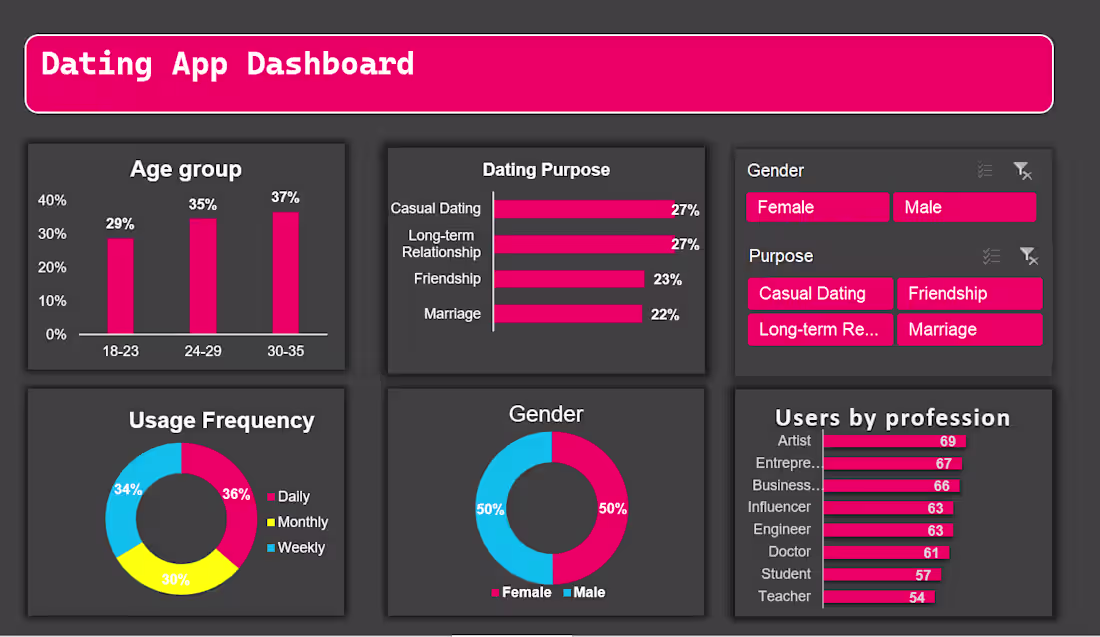
Dating app dashboard for analysis of dating trends and purpose
4
158
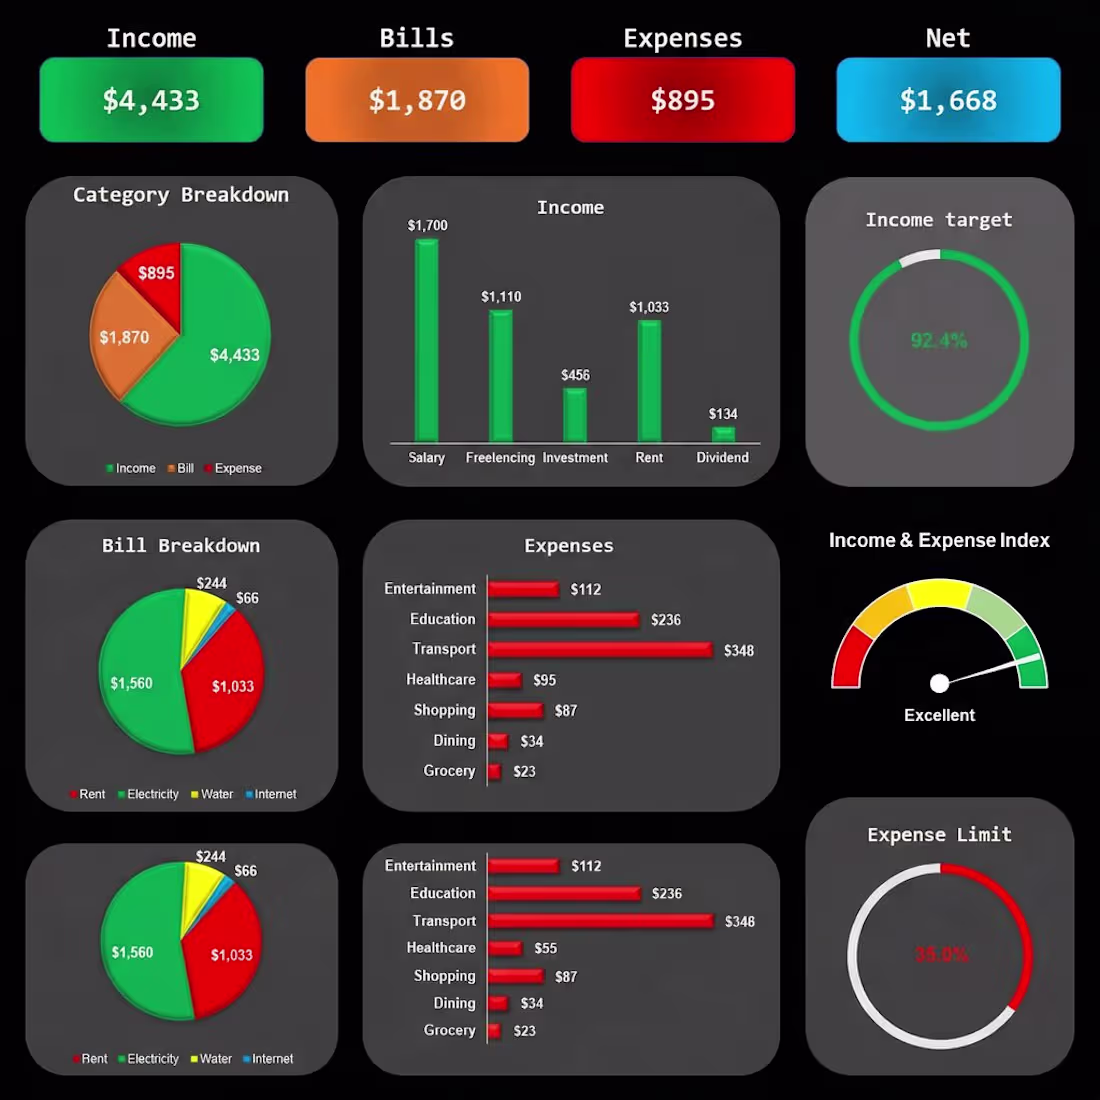
Automated Income & Spending Dashboard
1
51
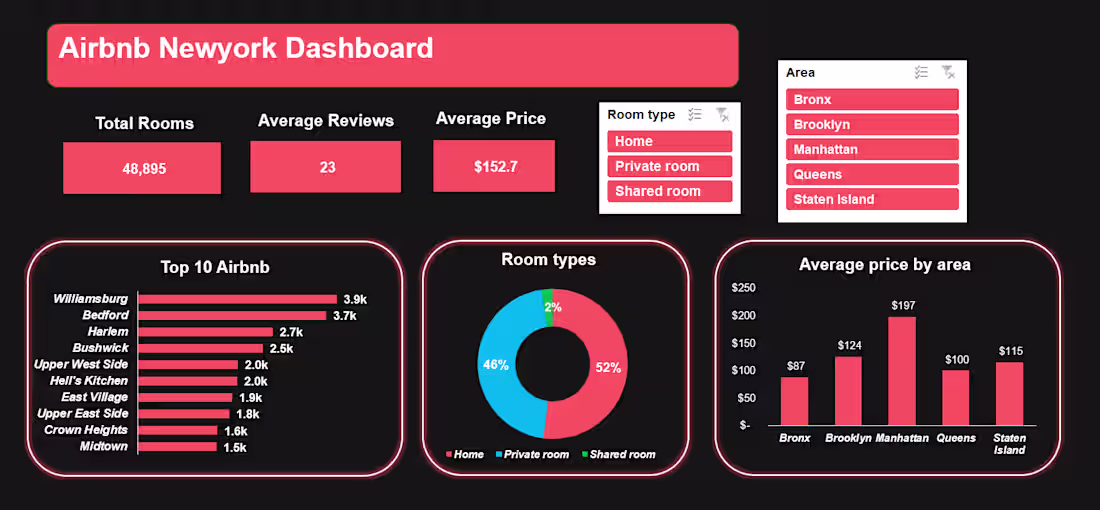
Airbnb Newyork Dashboard
4
98
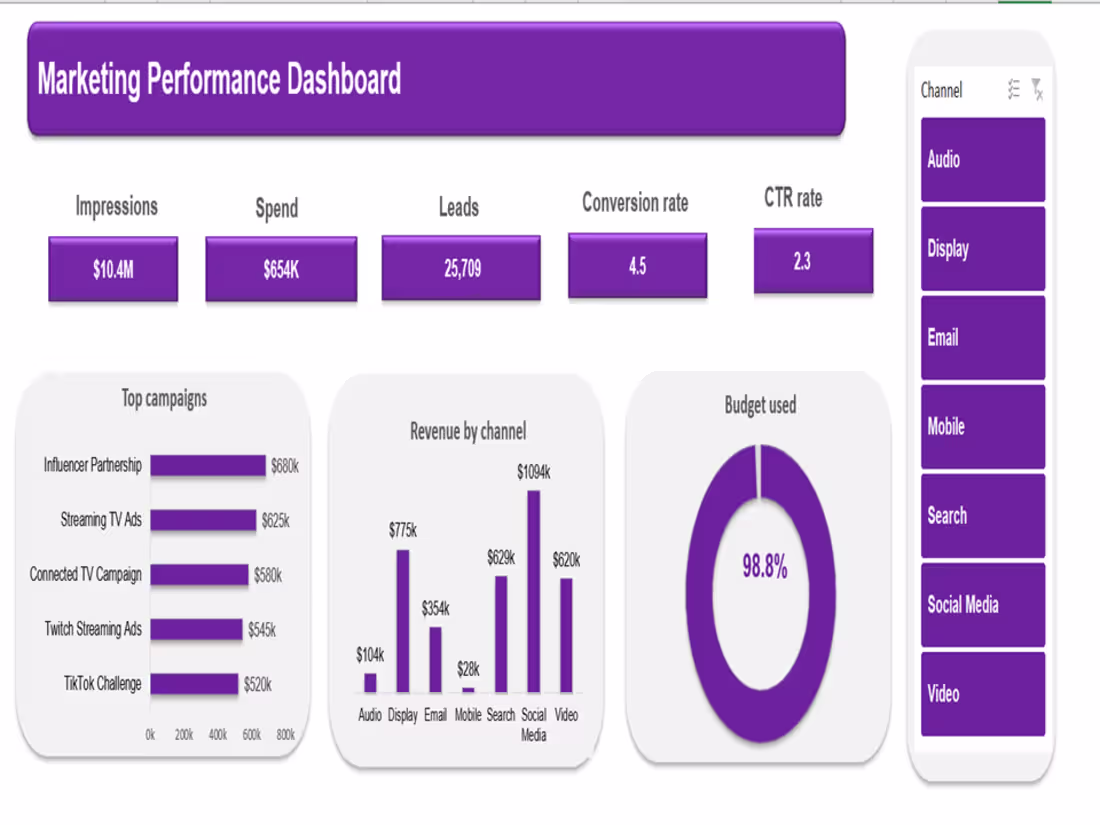
Marketing Performance Analysis Dashboard
3
126
Sales performance dashboard
3
93
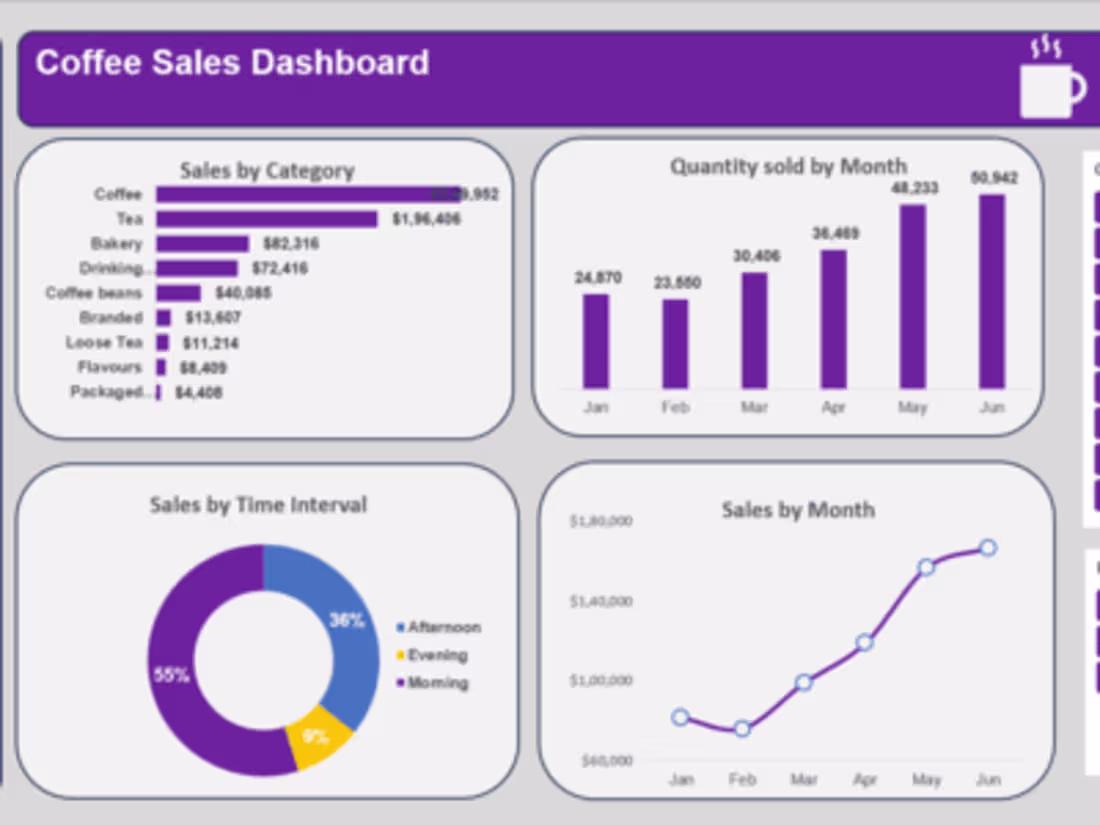
Coffee shops sales Dashboard
2
4
157