The network for creativity
Join 1.25M professional creatives like you
Connect with clients, get discovered, and run your business 100% commission-free
Creatives on Contra have earned over $150M and we are just getting started
Back to feedPost
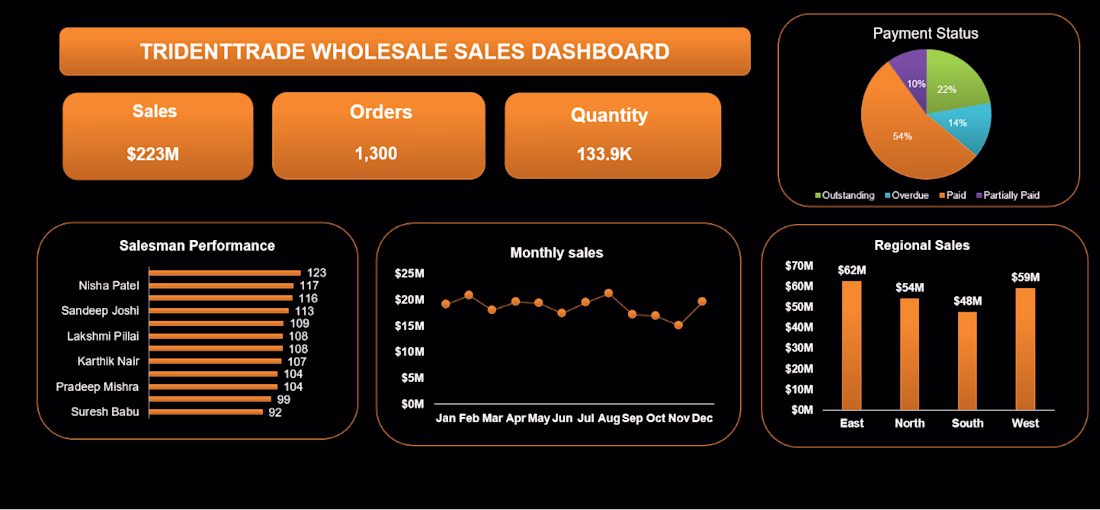
I built this dashboard to transform complex wholesale sales data into actionable intelligence.
This is exactly what it tracks:
→ Executive Snapshot: Key performance indicators (Sales, Orders, Quantity) at the top.
→ Payment Status: A real-time breakdown of outstanding, overdue, paid, and partially paid statuses to monitor cash flow.
→ Salesman Performance: A clean leaderboard to identify top contributors instantly.
→ Trend & Regional Analysis: Monthly sales velocity combined with a regional breakdown to see where the business is doing great.
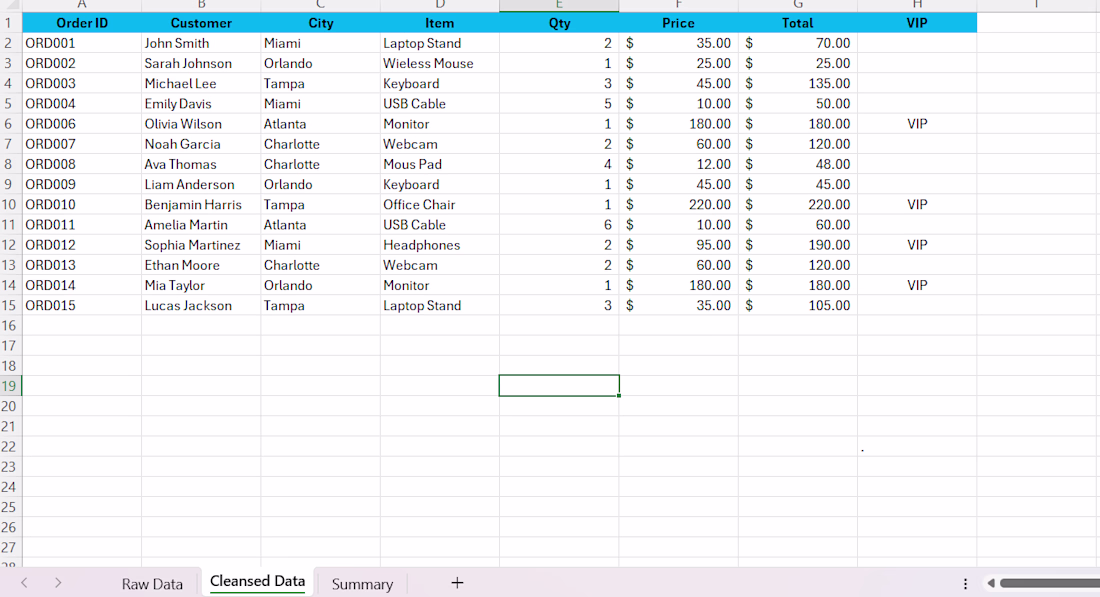
The raw data behind this was massive, but looking at it would only feel it's chaos.
This dashboard turns it into a 10 second task of understanding everything.
That is the whole point not just to make something look professional, but to make it functional.
P.S. If your business is still reading raw spreadsheet data to make decisions, I would love to show you what a custom dashboard could look like for your specific numbers.
The network for creativity
Join 1.25M professional creatives like you
Connect with clients, get discovered, and run your business 100% commission-free
Creatives on Contra have earned over $150M and we are just getting started
Related posts
Show us the raw data! 😄
Quick design question for fellow designers and founders.
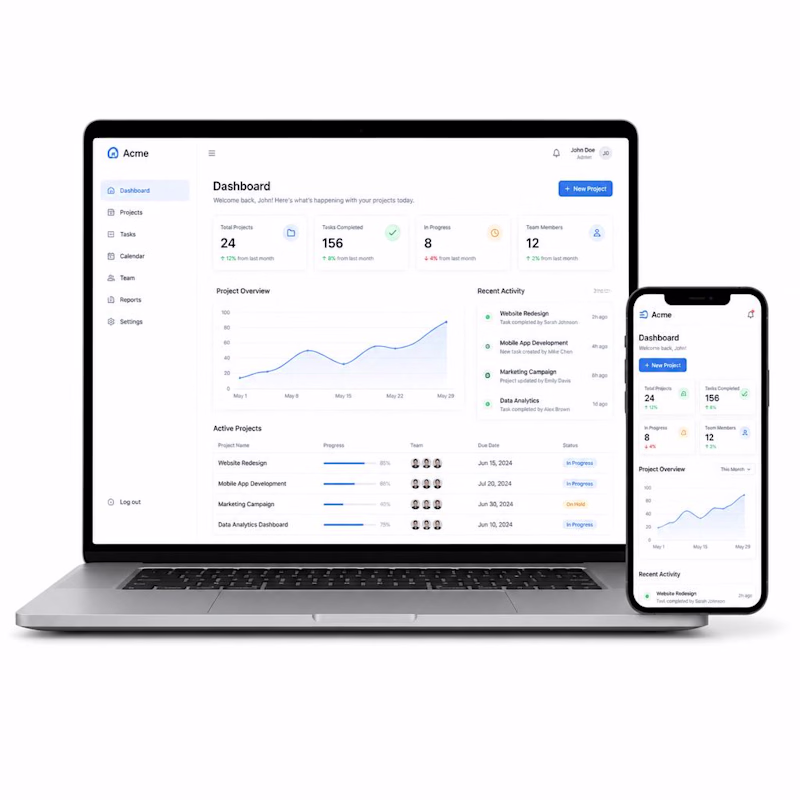
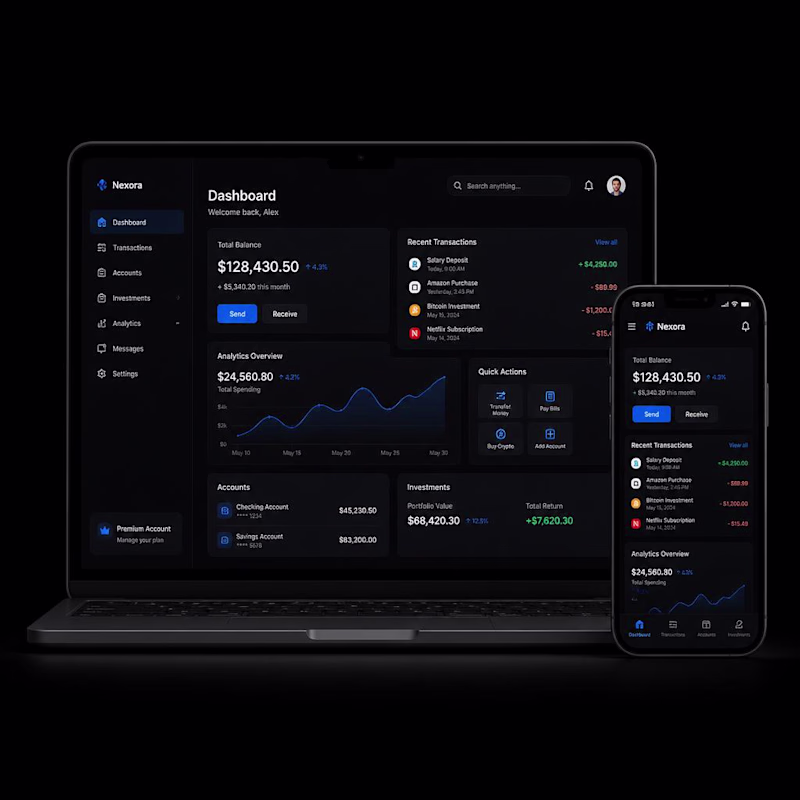
Which dashboard feels more premium to you?
☀️ A = Light Mode
🌙 B = Dark Mode
Let me know your choice.
5 voted
56%
4 voted
44%
9 votes
Closed
I choose dark mode
Productivity starts with the right interface. ✨
Designed this modern Task Management Dashboard to help teams stay organized, track progress, manage timelines, monitor productivity, and collaborate effortlessly—all within a clean, intuitive, and user-focused experience.
Minimal design. Powerful insights. Better workflow. 🚀
What feature would you add to make this dashboard even more effective?
Outstanding work
Challenges
View allTrending
Claude
Claude has entered the design space. How are you using Claude Design?
Contra University
Learn from expert creatives how to earn more using next-gen AI tools.
fifaworldcup2026
The World Cup is here and the whole world's watching. How are you designing for the world stage?
creativeaiflow
Creative AI workflows are evolving. What tools do you use, and what are their strengths and weaknesses?
freelancerlife
Freelancer life is wins, pivots, and everything in between. What’s yours right now?