The network for creativity
Join 1.25M professional creatives like you
Connect with clients, get discovered, and run your business 100% commission-free
Creatives on Contra have earned over $150M and we are just getting started
Back to feedPost

Built an interactive Power BI executive dashboard tracking $4.3M in revenue. Cleaned three raw data exports in Power Query, designed a star schema data model with 12+ DAX measures, and delivered actionable insights across segments, regions, and product categories.

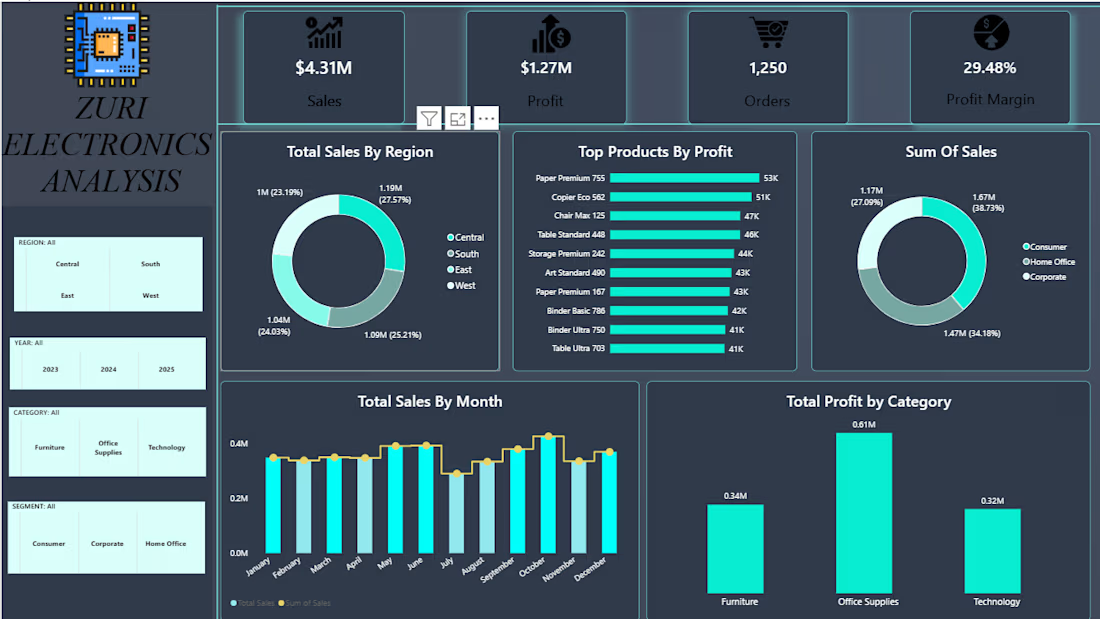

Clean dashboard! Love the $4.3M tracking.
I build similar executive dashboards for S&P Global with 12+ DAX measures too.
Let's connect


The three raw exports getting cleaned into one star schema is probably 80% of this project but its the part that never shows up in the screenshot. executives just see the donut charts. only a few sees the schema decisions that made 12 DAX measures actually run fast instead of choking on a flat table
The network for creativity
Join 1.25M professional creatives like you
Connect with clients, get discovered, and run your business 100% commission-free
Creatives on Contra have earned over $150M and we are just getting started











Related posts

How I Built an End-to-End Sales Analytics Dashboard in Excel for an E-commerce Company
I recently completed an end-to-end sales analytics project using Microsoft Excel, transforming raw e-commerce sales data into an interactive dashboard that provides meaningful business insights.
In this project, I explored the data, performed analysis, identified key sales trends, and built an interactive dashboard to help businesses make data-driven decisions.
I documented the entire process, including the approach, tools, analysis, and dashboard development.
Read the full project walkthrough on Medium: https://medium.com/@Refino/how-i-built-an-end-to-end-sales-analytics-dashboard-in-excel-for-an-e-commerce-company-e8692d81f354


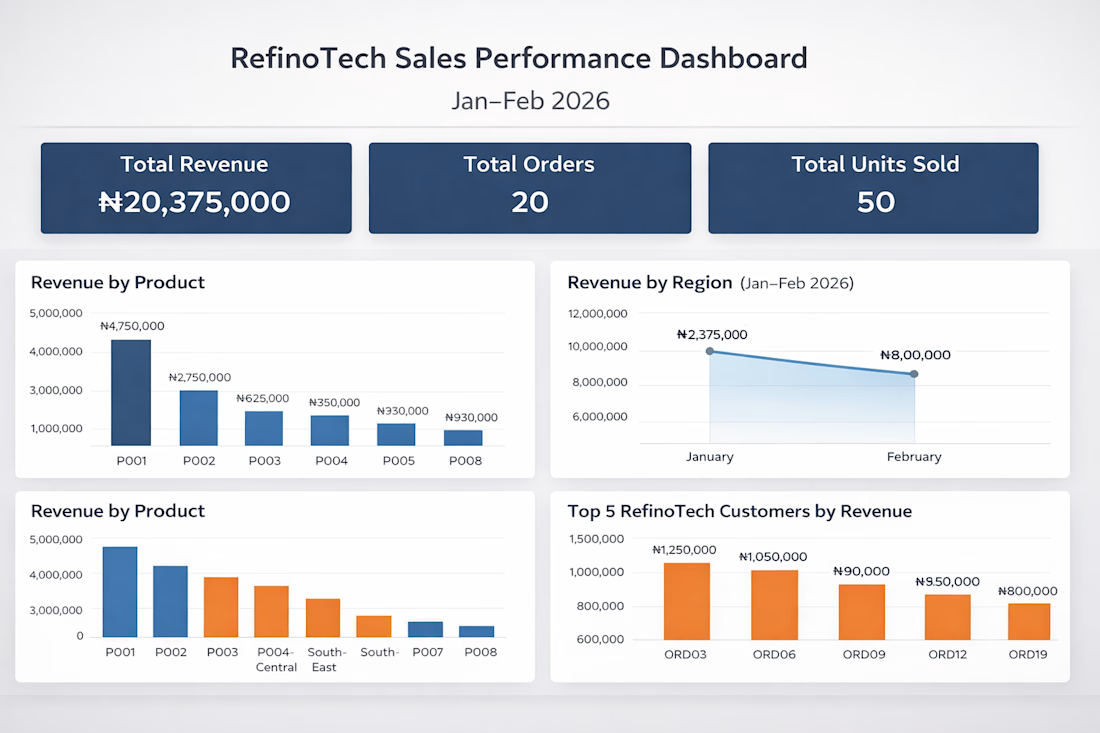

Excellent work! Turning raw data into actionable business insights is a valuable skill.


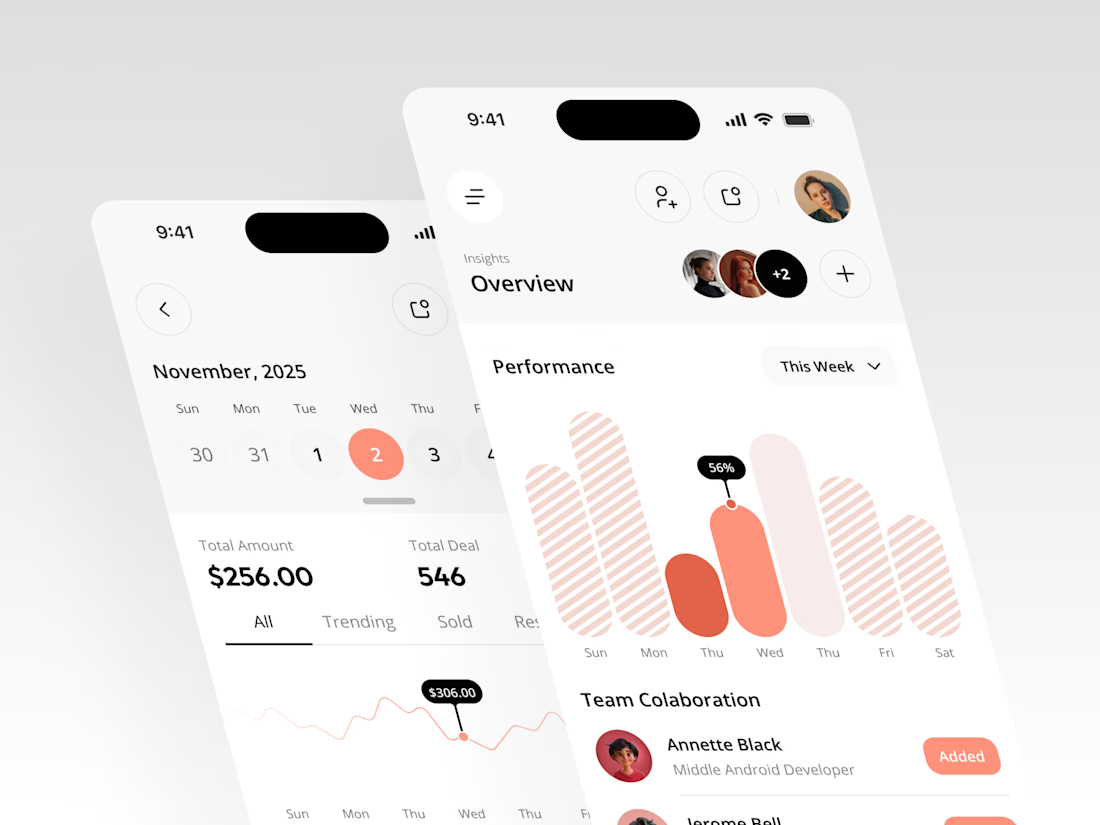

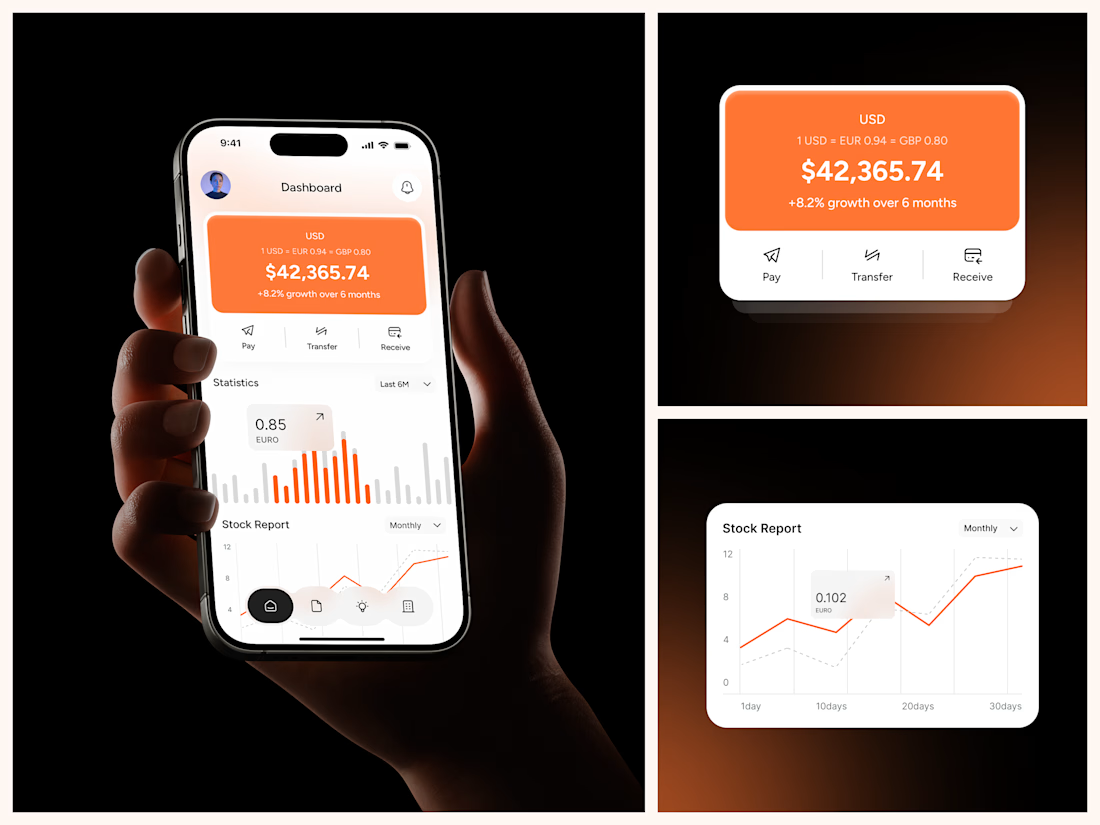

The coral red charts against the dark phone-in-hand shots make this pop, Rakesh. That Performance bar visual with the team collaboration section underneath gives the whole thing a real product feel. Clean mobile dashboard work.

Title / Headline:
Atlas of Cities — Editorial Web Design & Brand Identity System
Description
Overview:
Atlas of Cities is an editorial-driven web experience designed to translate complex urban analytics, housing statistics, and green space data into compelling, human-readable visual stories.
Design Highlights:
Modular Grid System: Engineered a high-density, structured layout balancing editorial typography with high-impact data visualization.
Editorial Typography: Paired clean display serif typography with ultra-legible body fonts to deliver a premium publishing aesthetics.
Brand Identity & Color Palette: Minimalist high-contrast palette (Signal Red, Neutral Gray, Off-White) optimized for maximum legibility and brand authority.
Cross-Platform Responsive Design: Fully adapted desktop and mobile interfaces, ensuring a seamless reading experience across all devices.
Tools & Stack:
Figma, Design Systems, Typography Scale, Data Visualization Design, UI/UX Responsive Layouts.

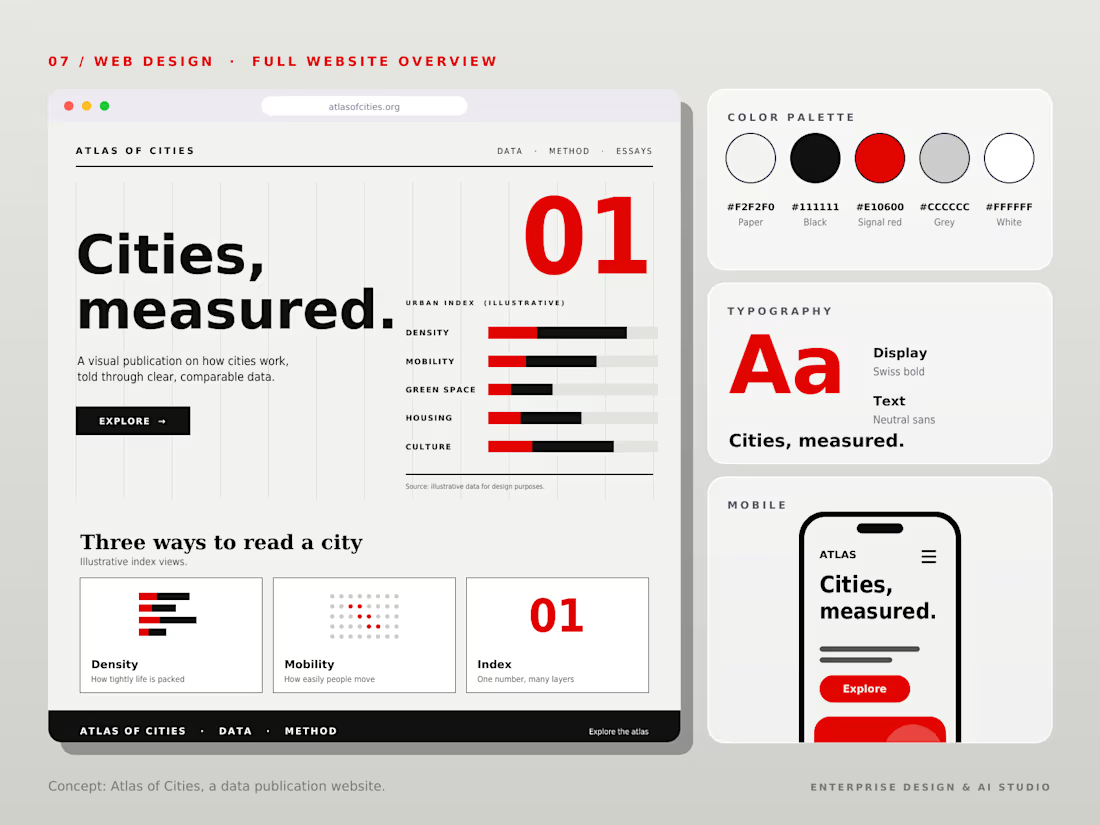
Turning urban analytics and housing stats into human-readable visual stories is a noble brief. The Signal Red accent cutting through the off-white gives it that premium editorial punch, and the modular grid keeps the density under control.