Bird Strikes by Airplane
Priya Dhari Singh
The dataset showcases the bird strikes by the different airlines at different altitude. It also narrates the bird strikes at different point in time that is year, month, quarter & date.
Cards:
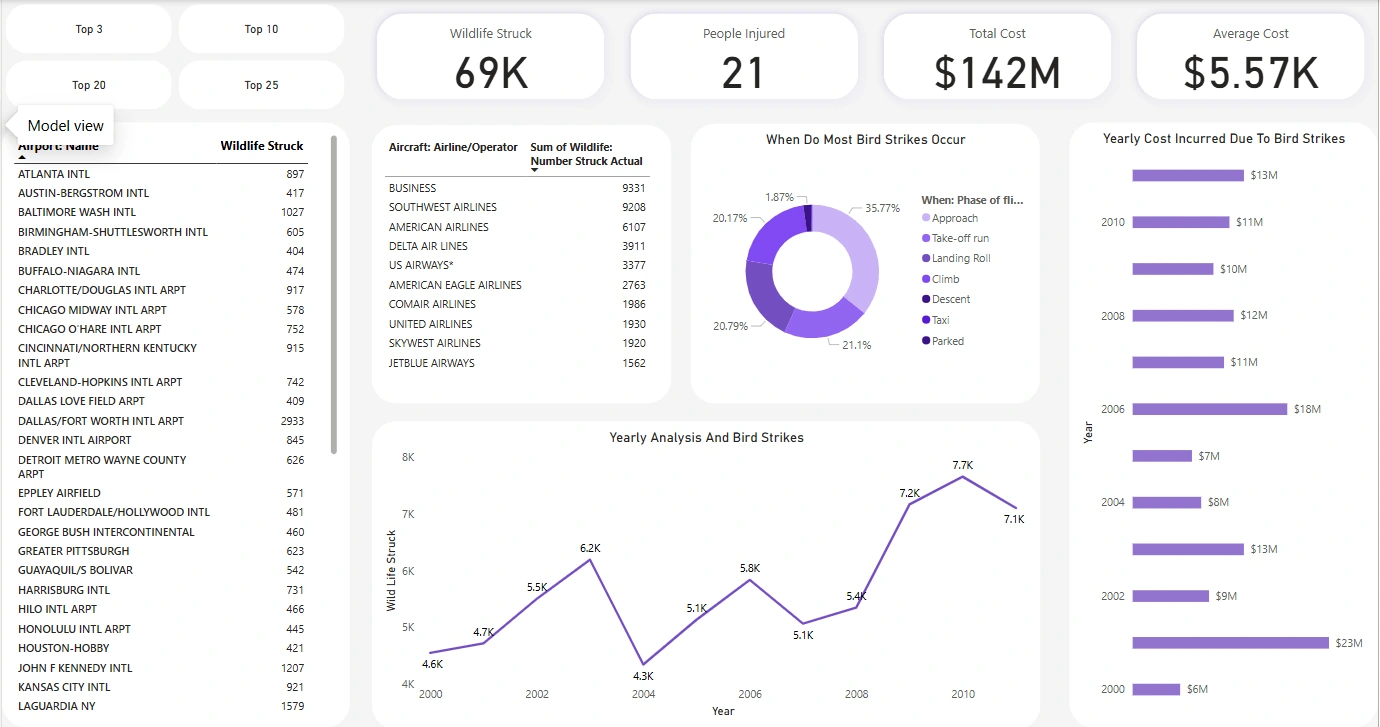
The cards talks about the people injured, total cost, wildlife struck, no. of records & average cost.
The no. of people injured are 21.
The total cost incurred by the airline is $142M.
The wildlife struck are 69K.
The average cost is $5.57K.
Bar Chart:
The bar chart shows the yearly cost incurred due to bird strikes. Millions of dollars are lost by the airlines due to bird strikes. The highest amount was incurred in the year 2001 & that was $23M.
Pie Chart:
It talks about the phase of the flight when most bird strikes occur. As per the graph, at the time of approach 35.77% of bird strikes occur which is the highest. The lowest is at the time when the flight is parked. Advanced technology should be diploid to ensure that birds don’t strike the aeroplane.
Matrix:
The first matrix is a detailed analysis about airline & Number of wildlife struck.
The second matrix talks about the wildlife struck with respect to the airport. It is affected by the slicer above it. The top 3 provides us with the top 3 airports with wildlife struck. The same is with top 10, top 20 & top 25.
Line Chart:
The line chart provides a detailed analysis about the number of wildlife struck with respect to the time series. The highest number of wildlife accident were reported in the year 2010 which was 7.7K.
The second line chart on the next page provides info about the altitude at which the plane was at different time of strike. The most number of bird strikes occur at the time of descent & the lowest is in taxi.
Waterfall Chart:
This talks about the altitude of plane at the time of strike. Most of the strikes take place at an altitude which is greater than 1000 feet. Only 14.8% of the strikes occur at a low altitude of less than 1000 feet.
Table:
The table gives an analysis about the effect of damage on the flight, the impact of flight, whether the pilots warned about it, the height of the flight above the ground & remarks about the accident.
Like this project
Posted Mar 7, 2025
This is dashboard showcasing the bird strikes by the airplane. It provides a detailed analysis about the time of the year when most bird strikes take place.
Likes
0
Views
1
Timeline
Jan 2, 2025 - Jan 5, 2025