I build AI-powered data apps and dashboards
Data Specialist for Clean, Organized & Smart Reports
"From Data Chaos to Business Clarity."
"From Data Chaos to Business Clarity."
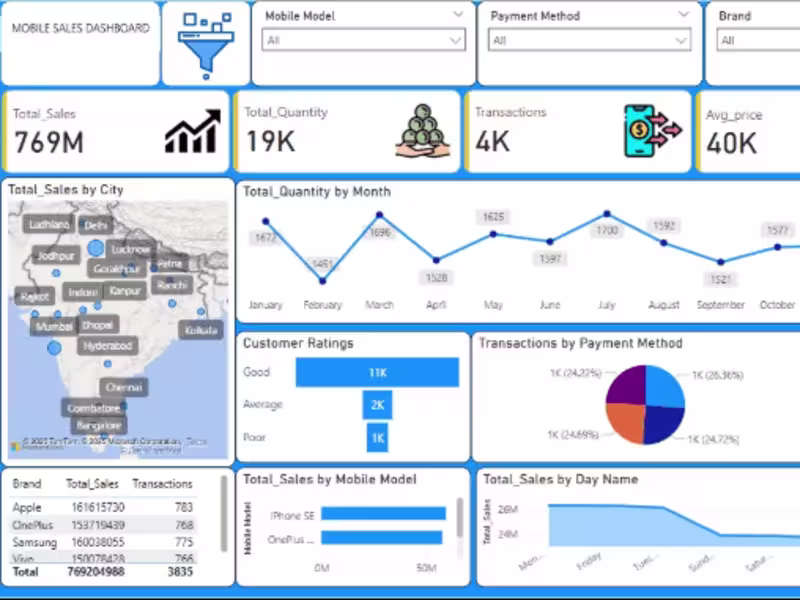
Data Analytics & Visualization Expert 🎯
Data Analytics & Visualization Expert 🎯
Transforming Brands through Web Design,Marketing & Analytics
- 1x
- Hired
- 5.0
- Rating
- 6
- Followers
Transforming Brands through Web Design,Marketing & Analytics


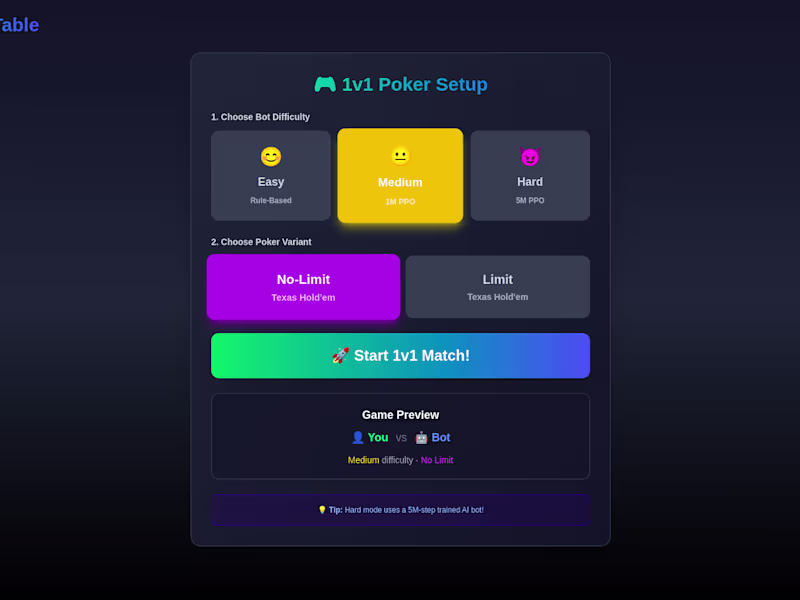
"ML Engineer | RAG Pipelines · LLM Fine-Tuning · RL
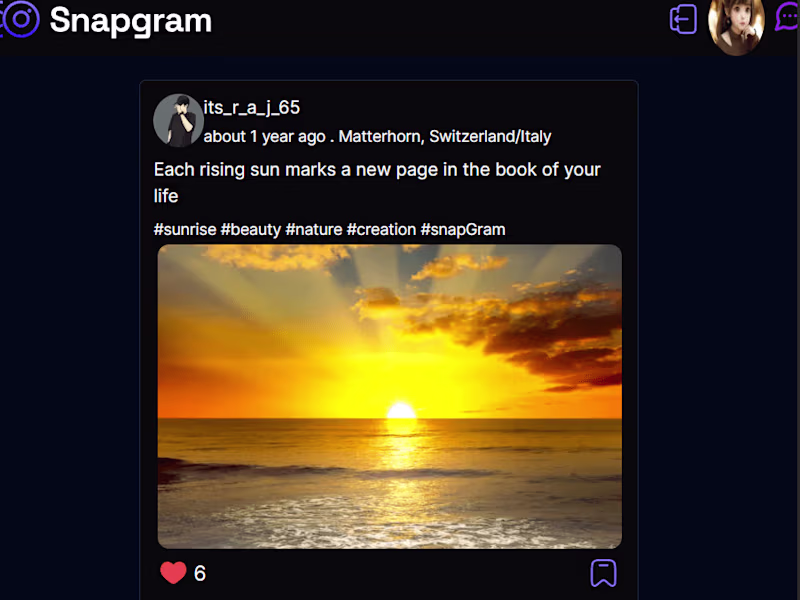
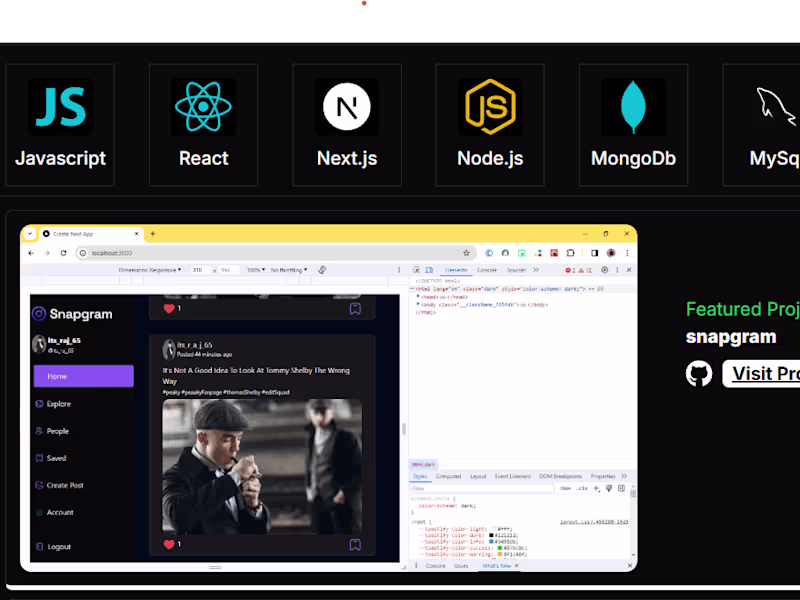
Next.js Full Stack Developer | Data Analyst
Next.js Full Stack Developer | Data Analyst

View more →
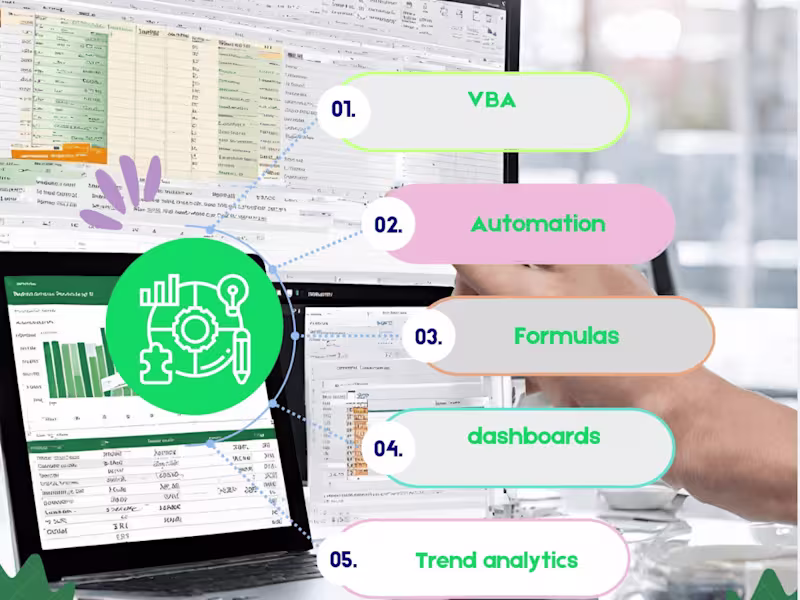
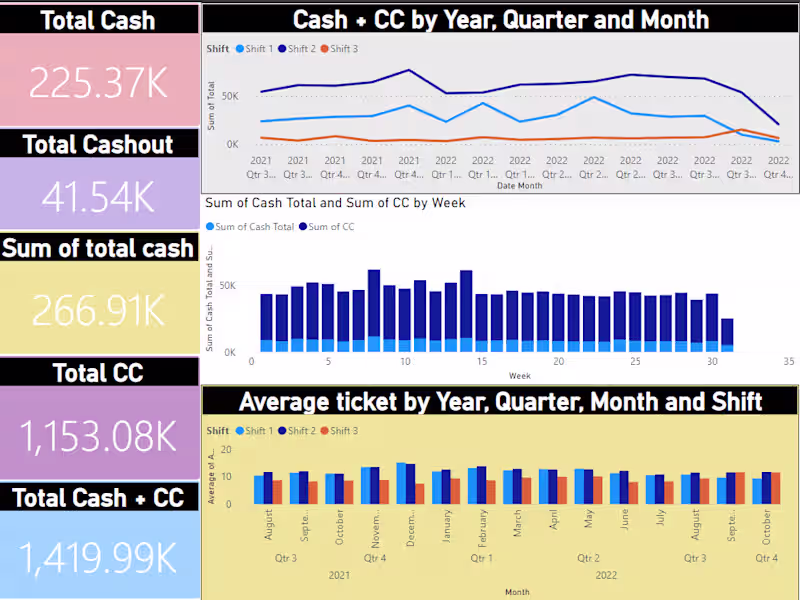
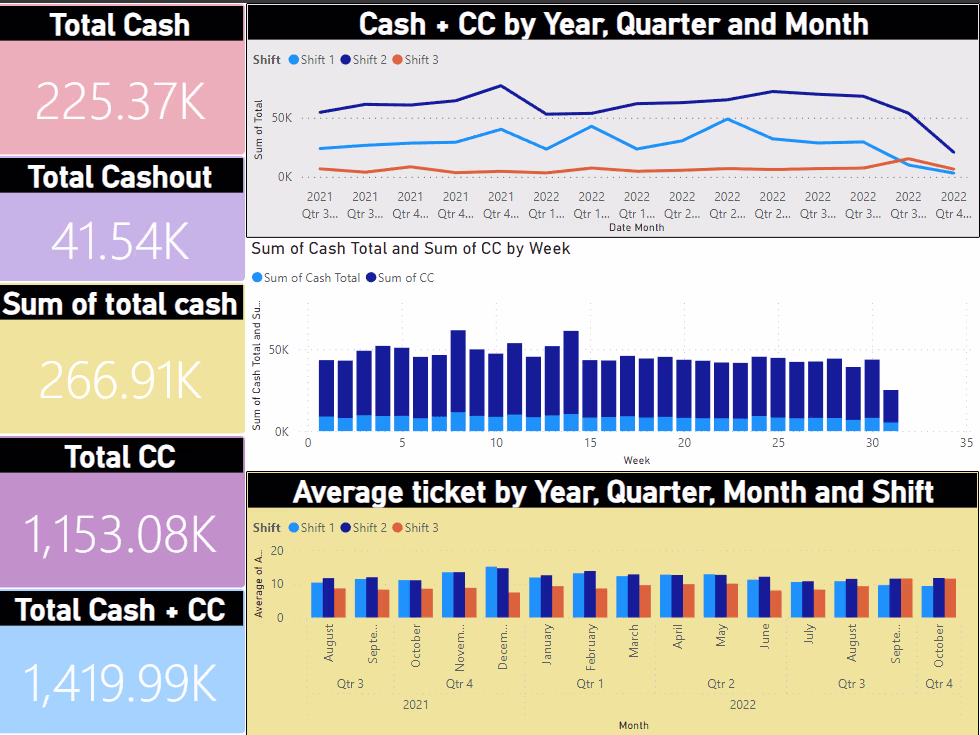
An Excel Expert - Specializing in Data Analysis
An Excel Expert - Specializing in Data Analysis


View more →