Blend Café Dynamic Pricing Recommendation Engine
Rushikesh Sagar

Blend Café — Dynamic Pricing Recommendation Engine
Data Science Internship | Blend Café, Deccan, Pune | July 1 – August 15, 2025 Headline result:+4.64%projected revenue uplift on the test period (Jul 16–31), strongest condition: Dinner × Clear After Rain (+10.9% per item)
What This Project Does
Blend Café (Deccan, Pune — adjacent to Fergusson College and BMCC) uses entirely static pricing. Every item has one fixed price regardless of time of day, weather, or demand pattern. This project builds a three-phase dynamic pricing recommendation engine that analyses 3 months of transaction data and recommends item-level prices per time slot, day type, and weather state.
Key engineering constraint: The café owner needed an explainable system. A neural network outputting a price is not explainable. A majority vote of three interpretable signals is.
Quick Numbers
Metric Value Revenue uplift (test period) +4.64% (₹8,793 on ₹1,89,322) Test period Jul 16–31, 2024 — 671 transactions Best single condition Dinner × Clear After Rain +10.9% Best slot Dinner +7.35% Best weather state Clear After Rain +7.60% Price recommendations generated 6,400 (200 items × 32 conditions) Floor violations 0 Premium items unflagged 0 HOLD rate 84.7% — intentional, brand-protective LR test RMSE 0.3972 RF test RMSE 0.4024
Project Structure
Environment Setup
How to Run
Run all scripts from the project root in order:
Each script prints a completion summary. All scripts are fully re-runnable — outputs are overwritten cleanly on each run.
Three Phases
Phase 1 — Excel Analysis (Weeks 1–2)
Manual Excel work on
Raw_Transactions. Pivot tables, ABC classification, revenue heatmaps, AOV analysis. Python scripts replicate and extend this in scripts/data_analysis/01–03.Key finding: 95 items (47.5% of menu) drive 69.6% of revenue. The classic Pareto 80/20 does not hold — Blend Café's revenue is broadly distributed. This shaped the decision to build models for the full 200-item menu rather than a short priority list.
Phase 2 — Statistical Analysis (Weeks 3–4)
Correlation analysis, price elasticity, Pareto validation, time series decomposition, demand segmentation.
Key finding: Weather is the strongest demand signal. Cold Brew vs Temperature:
r = +0.503. Footfall vs Revenue: r = +0.906. 38 items show a rain-boost effect — demand increases on Heavy Rain days (Masala Chai, soups, hot chocolate). Time series decomposition revealed the June monsoon dip and July college-return recovery cleanly in the trend component.Phase 3 — Machine Learning (Weeks 5–6)
25 engineered features, Linear Regression baseline, Random Forest primary model, three-signal price recommender, revenue uplift comparison.
Key finding and honest failure: Transaction-level quantity (
Quantity_Units) had insufficient variance for meaningful ML forecasting — 80% ones, 20% twos, std ≈ 0.40. Both LR and RF converged to predict the mean (RMSE ≈ 0.40, R² ≈ 0).Predicting the mean of 1.2 every time gives RMSE of 0.40. That is almost exactly what both models produced. There was no signal to learn.
Redesign decision: The price recommender was rebuilt using three direct demand signals — footfall vs baseline, weather state, and slot-day revenue percentile — with a majority-vote verdict per recommendation. More explainable, fully traceable, and does not depend on a near-constant target.
Key Design Decisions
Classical ML only — no deep learning 3,818 rows, binary-range target, non-technical audience. Random Forest with feature importances produces a chart explainable to a café owner. PyTorch would have overfitted and added zero interpretability.
Chronological train/test split Train: May 1 – July 15. Test: July 16–31. Random split explicitly rejected — a pricing model must generalise to future dates, not random past dates.
85% price floor — data-driven, not gut-feel Derived from Phase 2 customer segment analysis: Premium items are bought by customers for whom the price is part of the signal. Discounting below 85% destroys the brand signal that drives full-price sales on high-value evenings. Zero floor violations in 6,400 recommendations.
84.7% HOLD rate — intentional Dynamic pricing does not mean constant change. The system only changes prices when two of three signals strongly agree. 84.7% HOLD means the café charges its normal price most of the time. This was a design choice, not a limitation.
Data
All transaction data is simulated. Blend Café does not have a digital POS system. The simulation covers May–July 2024 (Pune summer through full monsoon) using historically grounded assumptions for Pune weather, Deccan-area footfall, and Blend Café's own menu timing windows.
Stat Value Simulation period May 1 – July 31, 2024 (92 days) Total transactions 3,818 rows Menu items 200 across 24 categories Total simulated revenue ₹10,40,338 Simulation seed 42 (fully reproducible)
The raw Excel has four sheets:
Raw_Transactions, Daily_Summary, Item_Master, and README. Only data/obs/ is read-only ground truth.Key Outputs
File Location Description
price_recommendations.csv data/models/ 6,400 recommended prices revenue_uplift_analysis.csv data/reports/ Static vs dynamic comparison project_evaluation_summary.csv data/reports/ All headline metrics project_summary.png data/data_analysis/charts/ Four-panel project overview demand_segmentation_2x2.png data/data_analysis/charts/ Item pricing segments revenue_uplift_waterfall.png data/data_analysis/charts/ Revenue impact waterfall chartSpecs and Documentation
Document Description
spec/interview_project.yaml Master technical specification — all decisions, thresholds, and rationale spec/companion.md Interview narrative, failure stories, Q&A referenceAbout Me
Final-year CS student in Pune building toward ML engineering roles at YC-backed startups. My work sits at the intersection of deep learning, reinforcement learning, and RAG/LLM systems — all applied to financial markets.
Other projects:
🤗
Rushisagar221/dalal-street-financial-llm — Fine-tuned Llama-3.2-3B for Indian equity analysis. Citation rate 0% → 100%.Crypto Phase 2 — Regime detection system (LSTM + GNN + PPO meta-model), live paper trading on Binance
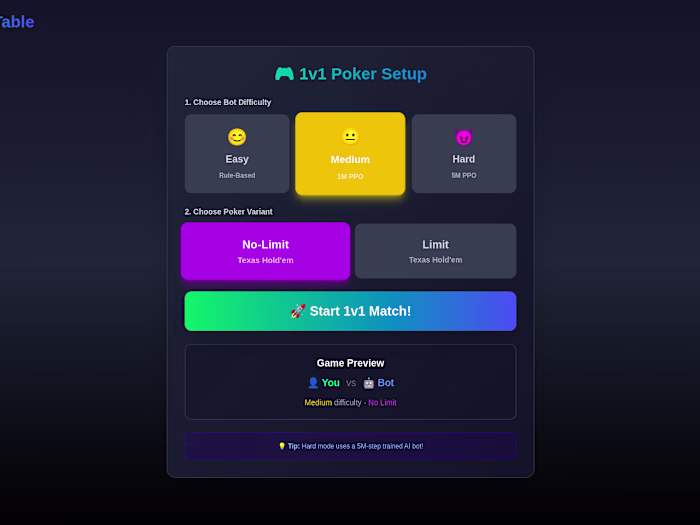
Poker PPO Bot — Deployed RL agent with FastAPI backend + React frontend
Blend Café Dynamic Pricing Engine — Data Science Internship, July–August 2025, Pune
Loading this content connects you to GitHub Gist.
GitHub Gist privacy informationLike this project
Posted Apr 27, 2026
6,400 price recommendations, 200 menu items. Diagnosed near-zero R², redesigned system. +4.64% revenue uplift.
Likes
0
Views
4
Timeline
Jul 1, 2025 - Aug 15, 2025