ML engineer helping startups turn data into insights.
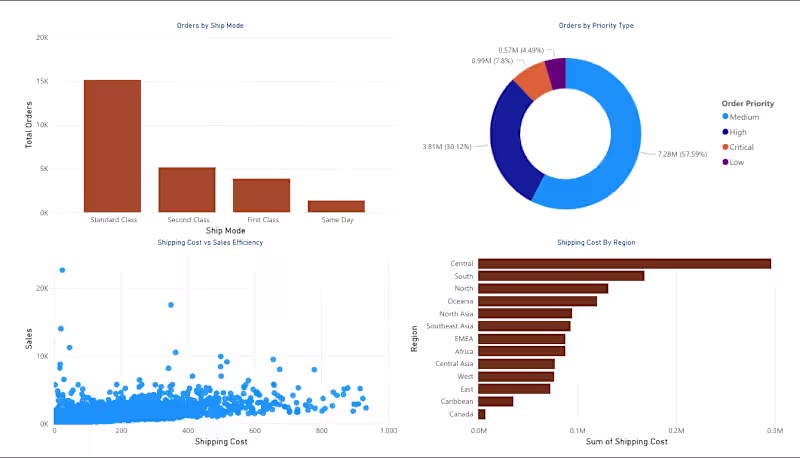
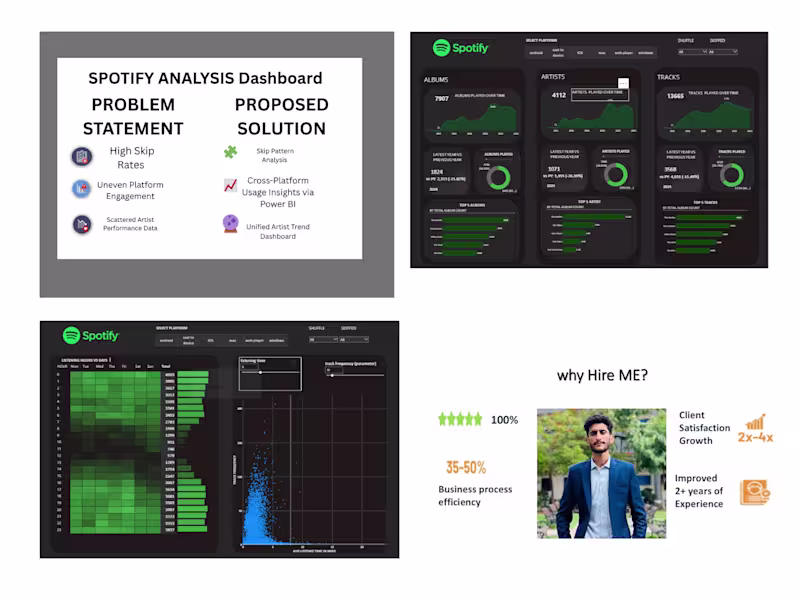
Data Analysis & Visualization | Power BI Specialist
Data Analysis & Visualization | Power BI Specialist


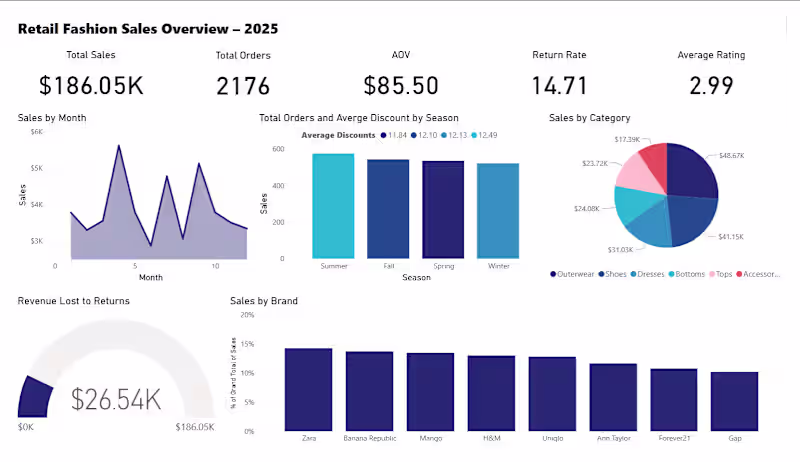
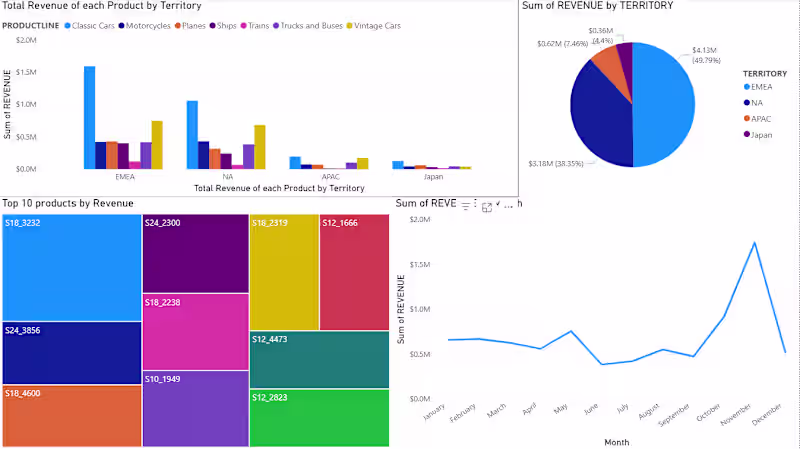
Turning complex data into actionable insights
Turning complex data into actionable insights


View more →
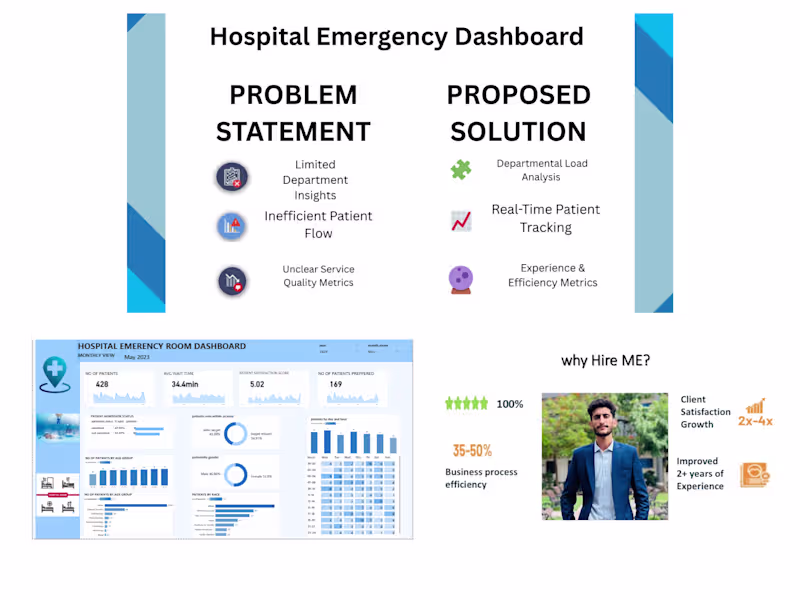
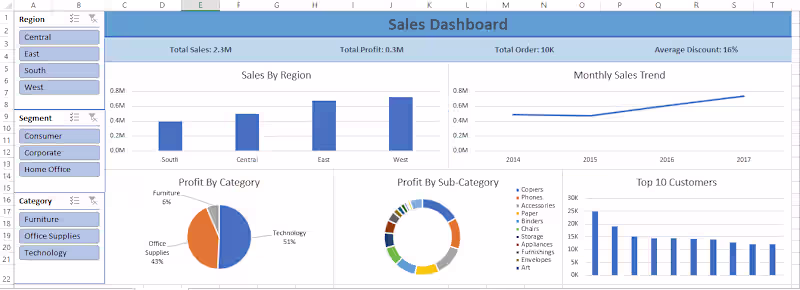
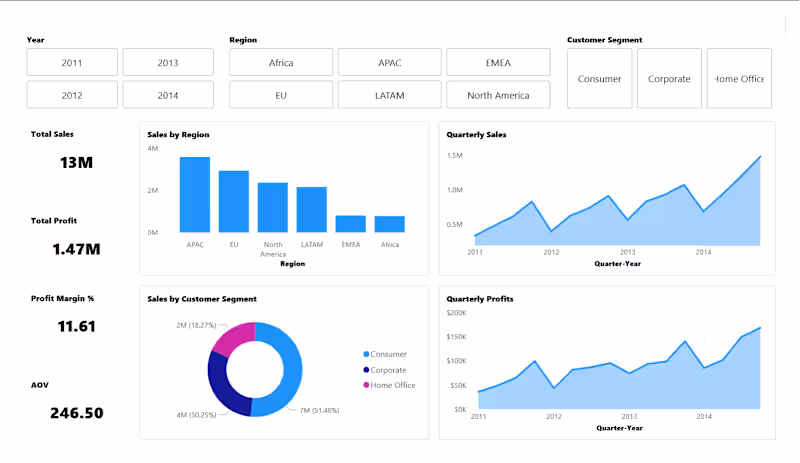
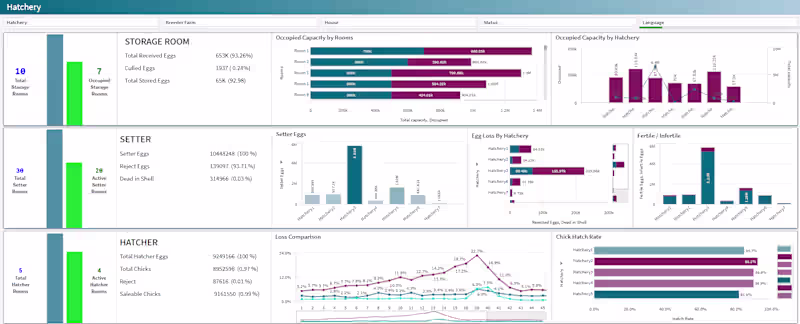
Transforming complex data into clear, strategic insights.
Transforming complex data into clear, strategic insights.

View more →
I build products that ship
and ideas that scale.
I build products that ship
and ideas that scale.


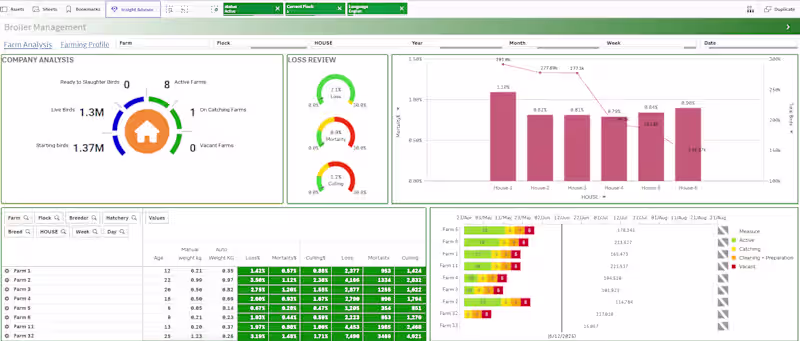
Data Scientist Transforming Ideas into Solutions
- $1k+
- Earned
- 2x
- Hired
- 6
- Followers
Data Scientist Transforming Ideas into Solutions


View more →
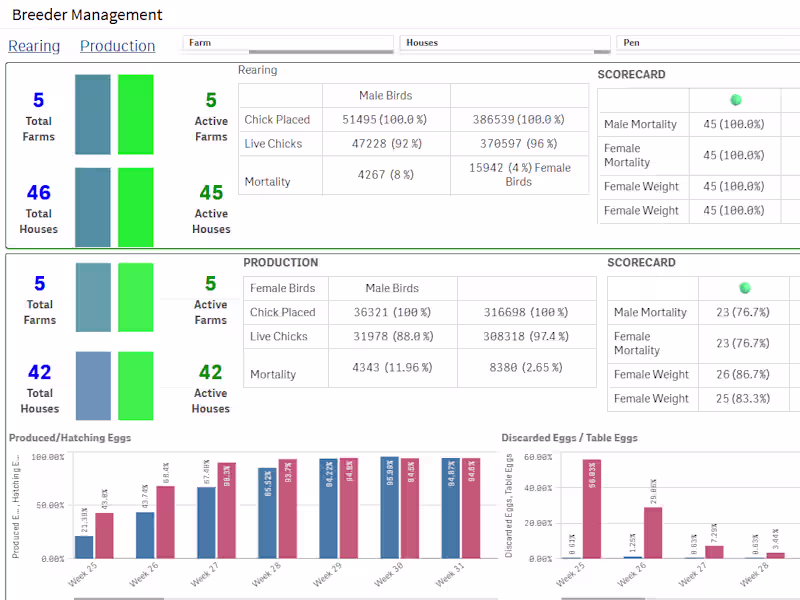
Data Analyst | Power BI, SQL, Python | From data to decision
Data Analyst | Power BI, SQL, Python | From data to decision