Financial Performance Dashboard
muneeb arshad
Global Superstore Financial Performance Dashboard
Project Overview
This project analyzes financial performance using the Global Superstore dataset. It measures revenue, profit, and discount effects across products, regions, and customer segments. The goal is to uncover trends, identify profit drivers, and visualize key business insights through Power BI.
Dataset Summary
The dataset contains global retail transactions across multiple categories and regions.
Key Fields:
Order Date: Time of sale
Region: Geographical market
Category & Sub-Category: Product classification
Sales, Profit, Discount, Quantity: Core financial metrics
Customer Segment & Ship Mode: Demographic and logistic details
Size: ~51,000 rows | Period: 2011–2014
Objectives
Track sales and profit performance across dimensions.
Measure the effect of discounts on profitability.
Identify high-performing regions, products, and customer segments.
Visualize trends to guide business decisions.
Analysis Focus & Key Questions
How have sales and profits evolved over time?
Which regions and categories drive most revenue and profit?
Do discounts improve sales or reduce margins?
Which customers contribute most to revenue?
What is the overall profit margin by region and product type?
Visualizations
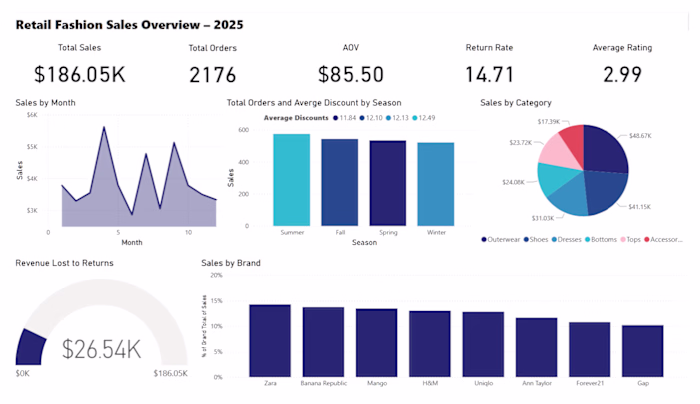
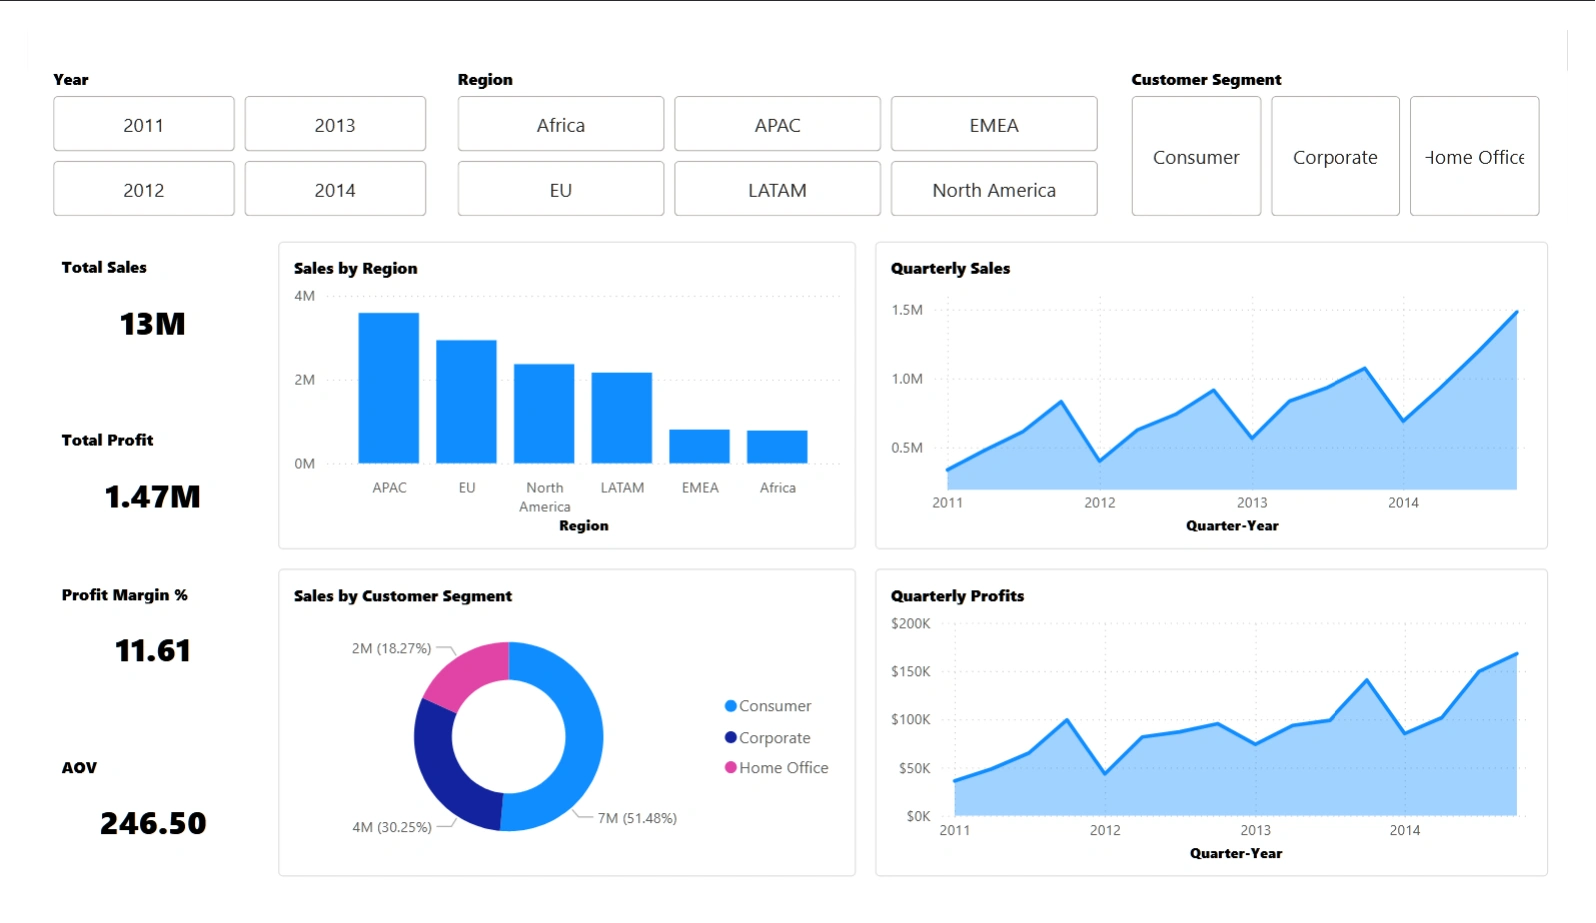
KPI Cards: Total Sales, Profit, Margin, Discount
Line Chart: Monthly Sales & Profit Trend
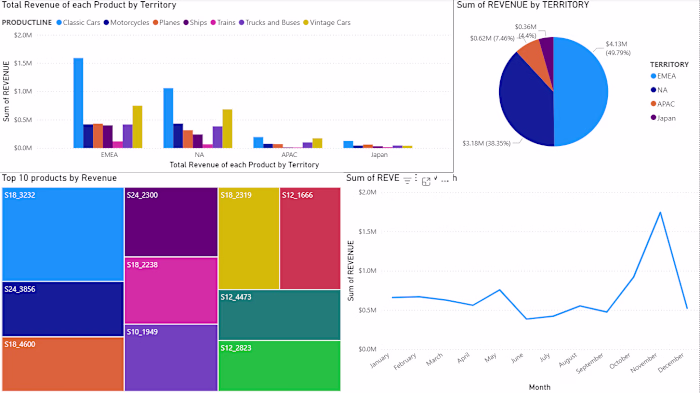
Bar Chart: Profit by Region / Category
Pie Chart: Revenue Share by Segment
Scatter Plot: Discount vs Profit
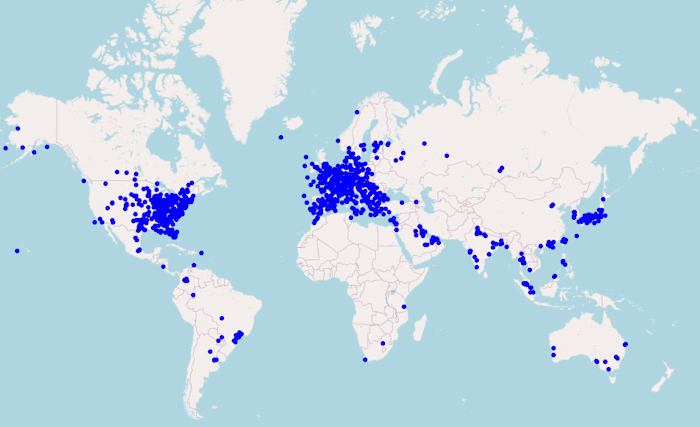
Map: Regional Sales Distribution
Table: Top 10 Customers by Total Spend
Results & Insights
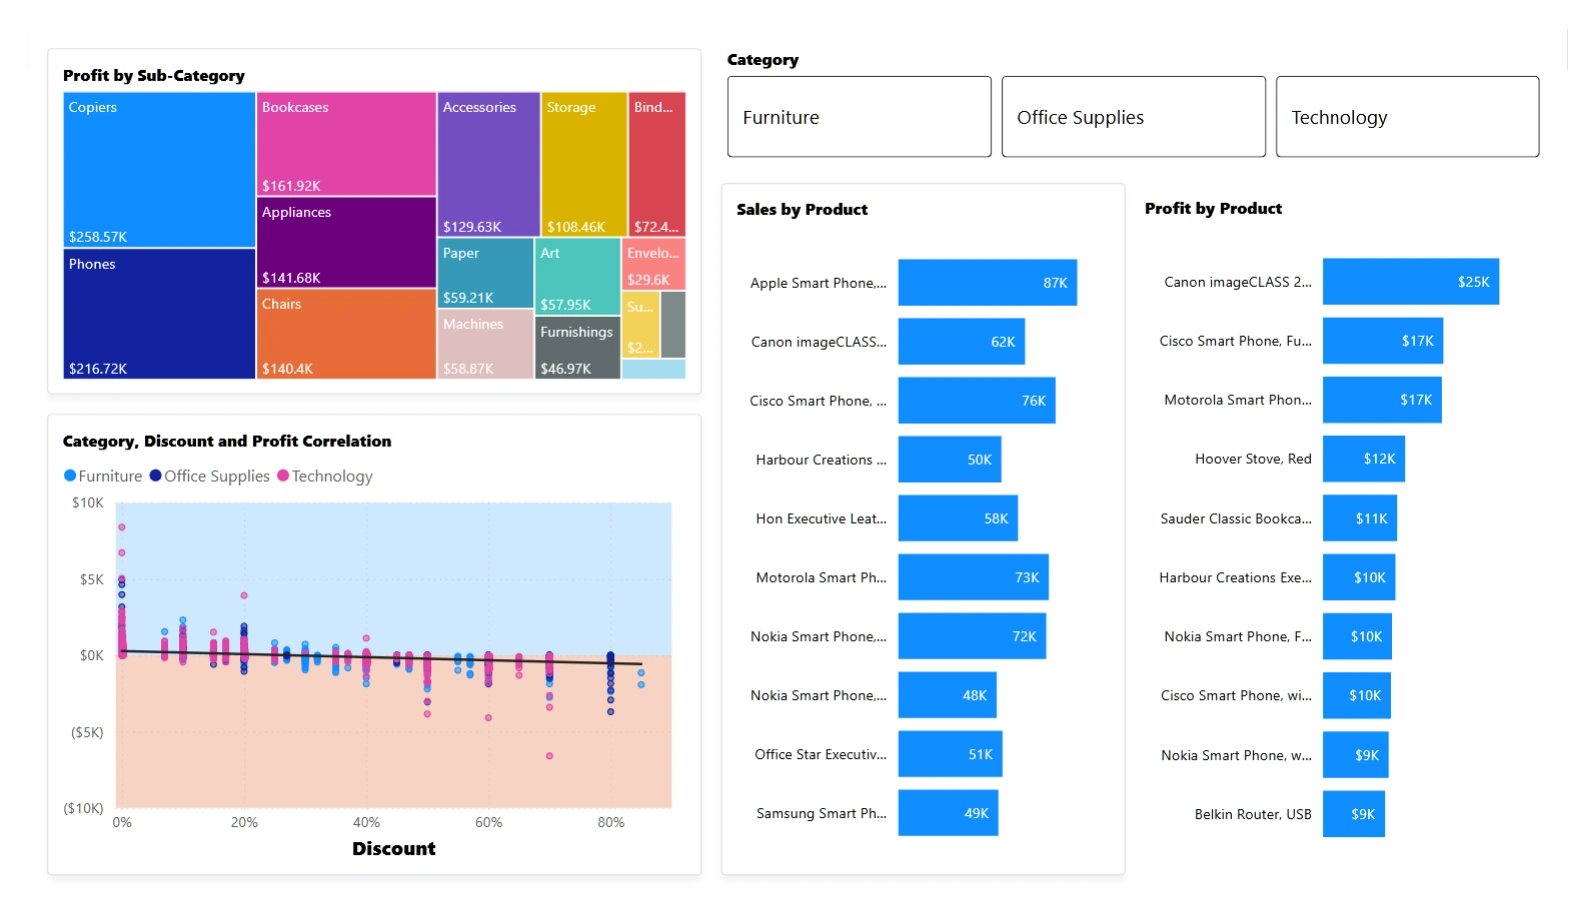
Product Performance
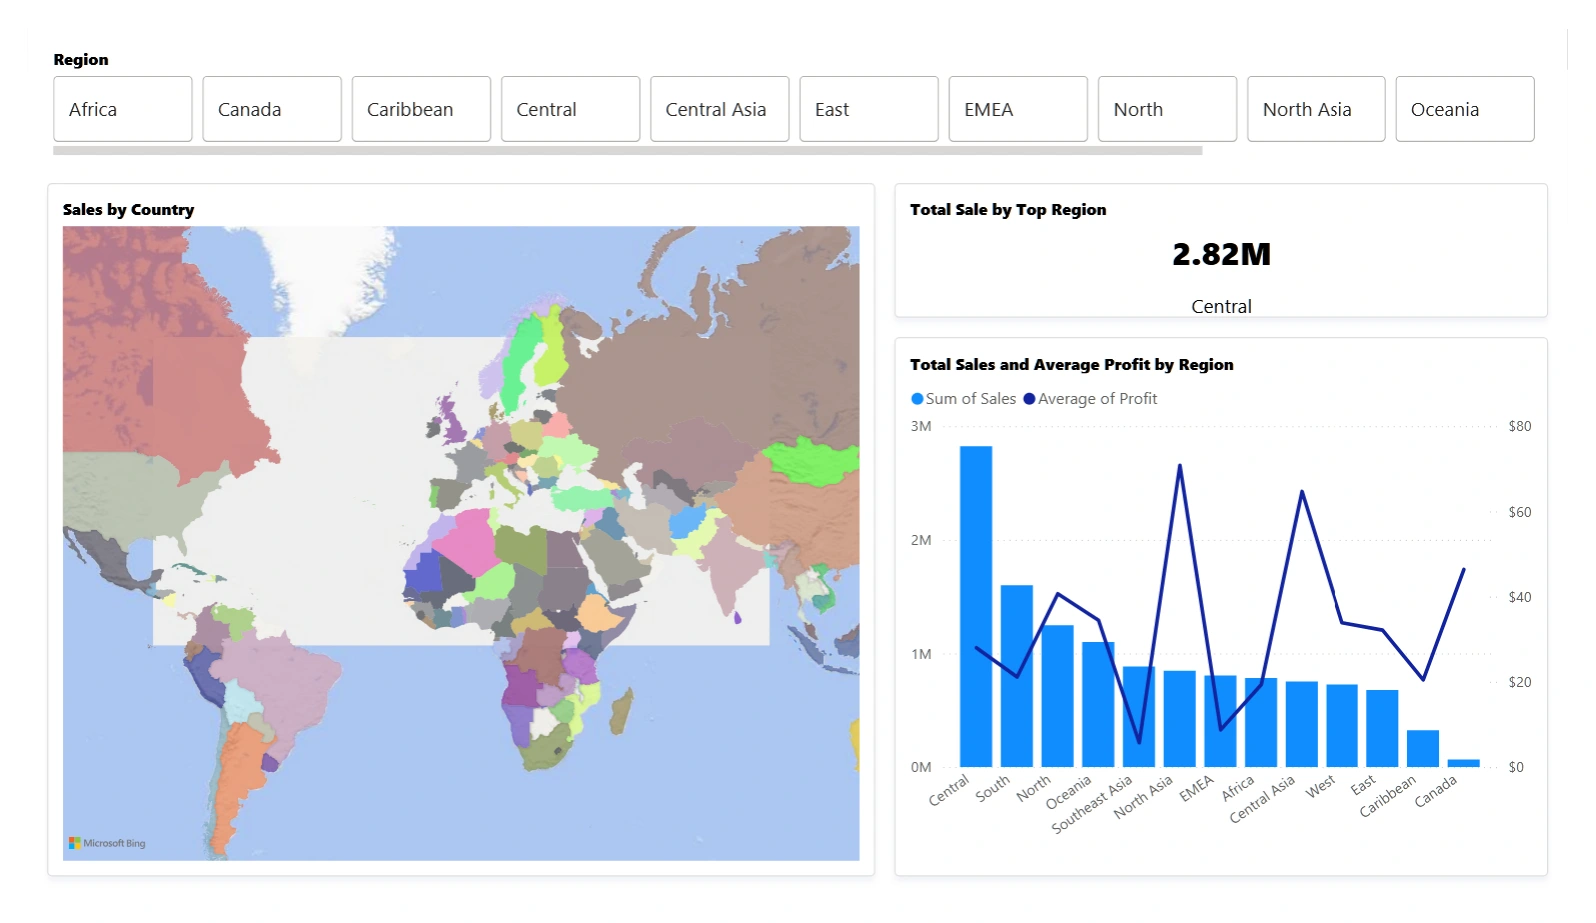
Regional Analysis
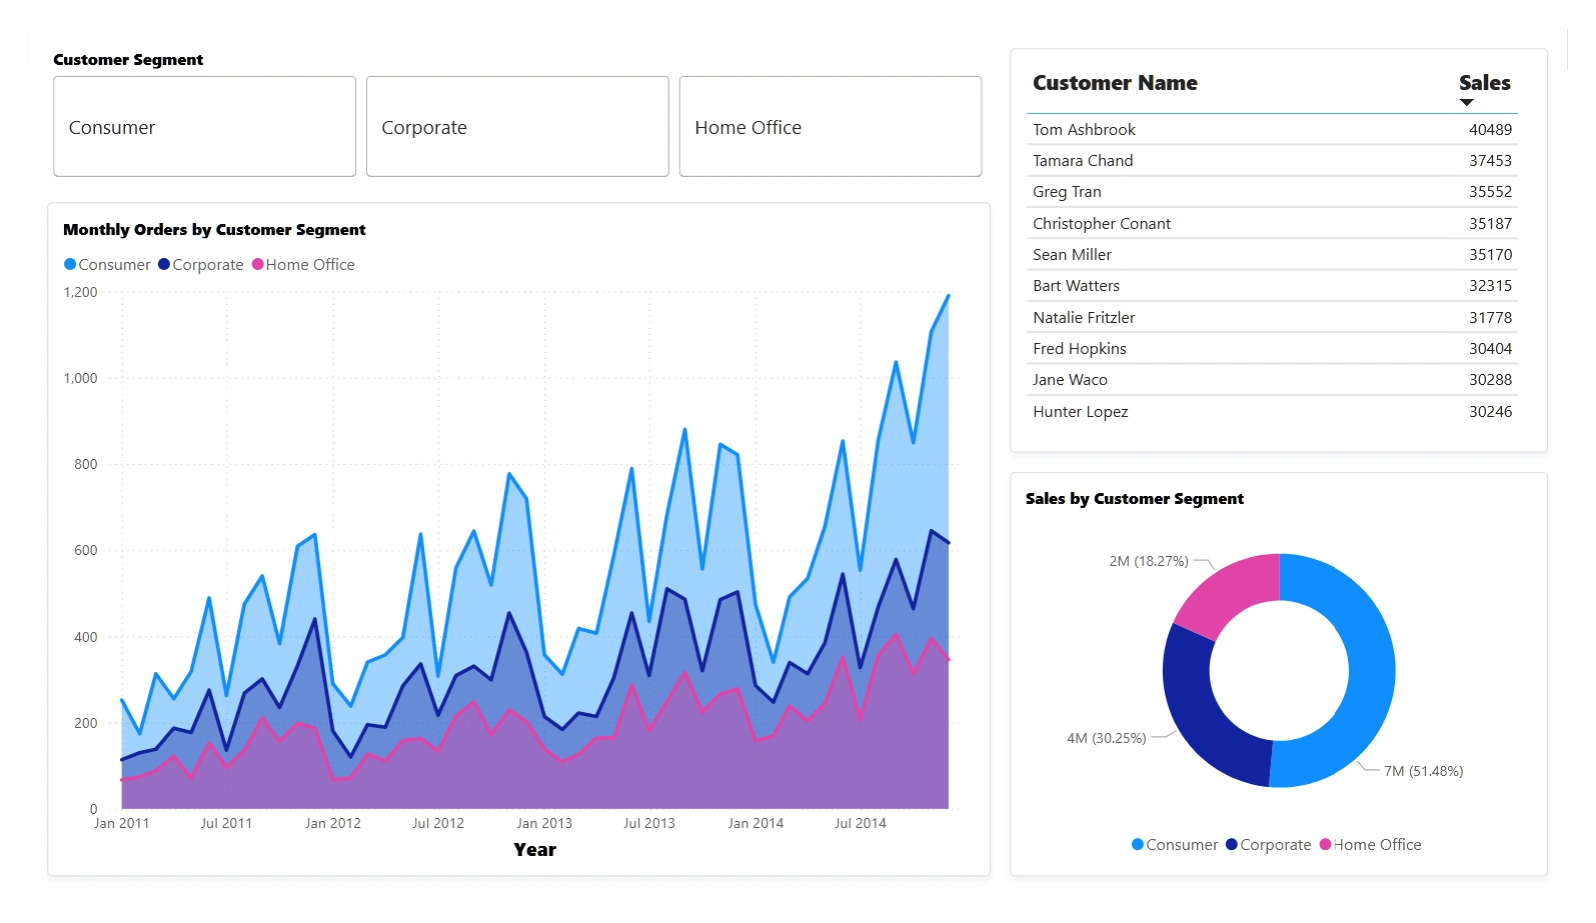
Customer & Segment Insight
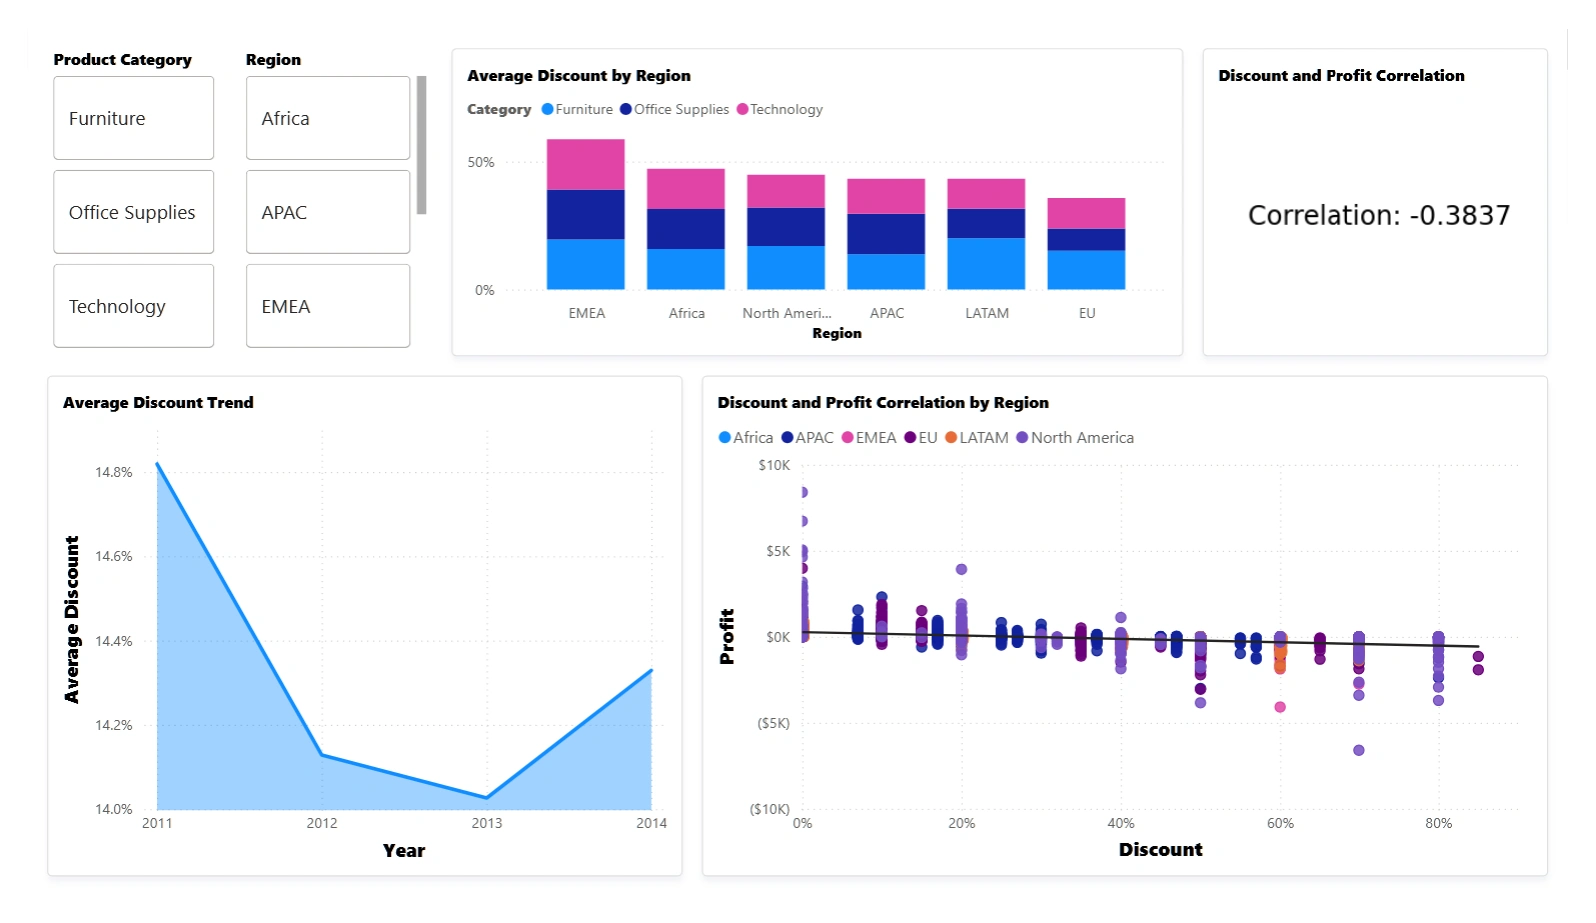
Discount & Profitability
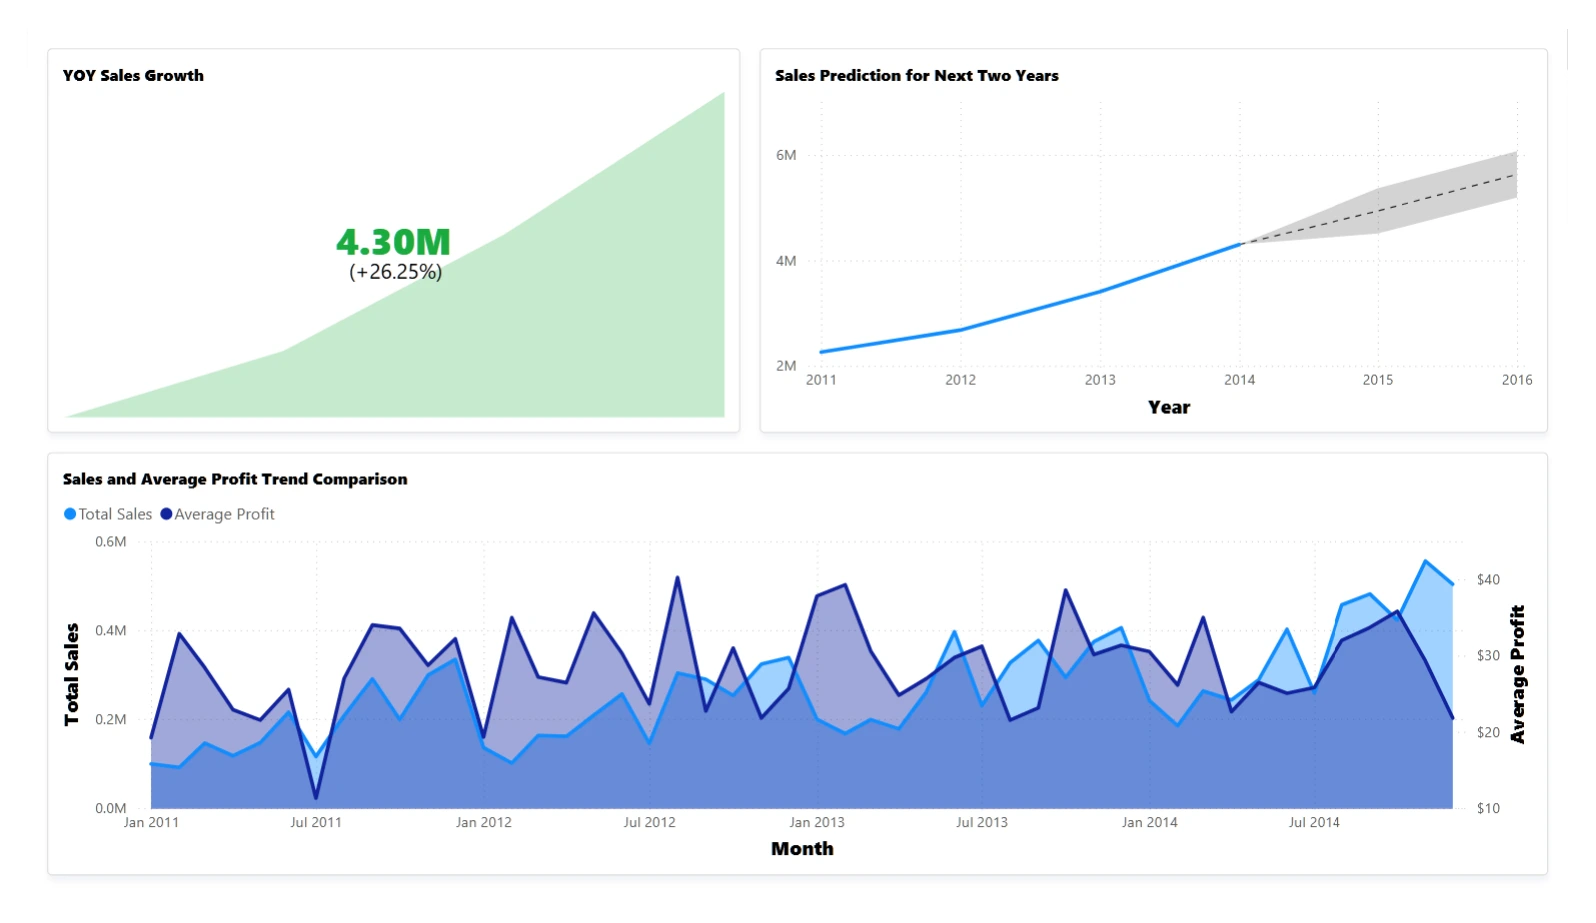
Trend Analysis
Tools & Technologies
Power BI: Data modeling and visualization
Power Query: Data cleaning and transformation
DAX: Calculated measures and KPIs
Excel / CSV: Data preparation and validation
Summary
The dashboard delivers a concise, visual summary of the Global Superstore’s performance.
It highlights how revenue, profit, and discount policies interact across global markets.
This analysis supports decision-making in pricing, regional focus, and sales strategy.
Author: Muneeb Saddal
Data Source: Global Superstore Dataset – Kaggle
Like this project
Posted Oct 25, 2025
Analyzed Global Superstore's financial performance using Power BI to visualize key insights.
Likes
0
Views
4