Retail Fashion Boutique Sales Analytics 2025
muneeb arshad
Retail Fashion Boutique Sales Analytics 2025
Project Overview
This project analyzes a comprehensive retail dataset featuring multi-brand fashion sales across multiple seasons. The goal is to uncover insights on sales performance, pricing effectiveness, customer behavior, and return patterns, helping businesses optimize revenue and customer satisfaction.
The dataset captures the complete sales cycle — from purchase patterns and pricing strategies to customer ratings and returns, making it ideal for end-to-end data analytics, visualization, and business intelligence.
Objectives
Analyze key performance metrics across brands, categories, and seasons
Identify the effect of pricing and discounts on sales performance
Study customer satisfaction and behavior patterns
Investigate return reasons and their financial impact
Build data visualizations to support retail decision-making
Dataset Summary
Highlights:
8 major fashion brands
4 seasonal cycles with markdowns
Product details, sales transactions, pricing, and return information
Customer ratings and return reasons
Realistic business logic (markdowns, return rates, missing values)
Analysis Focus & Key Questions
1. Sales Performance
Which brand or category drives the highest revenue and profit?
What are the top-performing months or seasons?
How do sales differ across product categories and price ranges?
What is the average order value and monthly revenue trend?
Metrics:
Total Sales, Profit, Units Sold, AOV, Revenue by Season/Category2. Pricing & Discount Strategy
How do markdowns influence sales performance?
Is there a correlation between discount percentage and product returns?
Which brands respond best to price reductions?
Metrics:
Average Discount, Revenue Lift from Markdown, Discount vs Sales Correlation3. Customer Behavior & Satisfaction
Which brands or categories have the highest average rating?
Do lower ratings correlate with higher return rates?
What factors influence customer satisfaction?
Metrics:
Average Rating, Return Rate by Rating, Loyalty Index4. Return Analysis
Which categories or brands have the most returns?
What are the most common reasons for returns?
What is the revenue loss due to returns?
Are returns related to discounts or customer ratings?
Metrics:
Return Rate, Revenue Lost to Returns, Return Reasons, Return Correlation with Discount5. Seasonal Trends
Which products perform best in each season?
How do markdowns and sales volumes vary by season?
Is there a seasonal impact on returns or satisfaction?
Metrics:
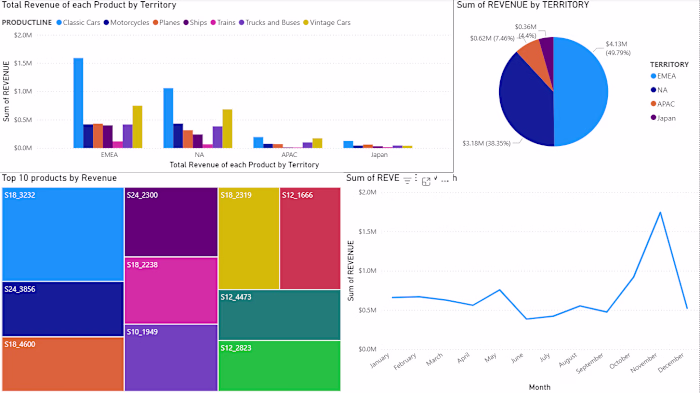
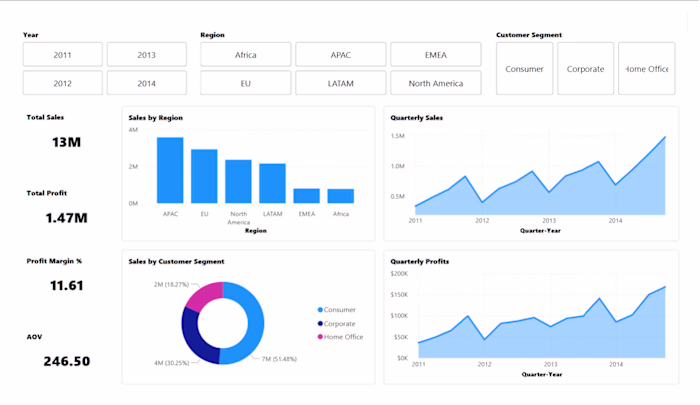
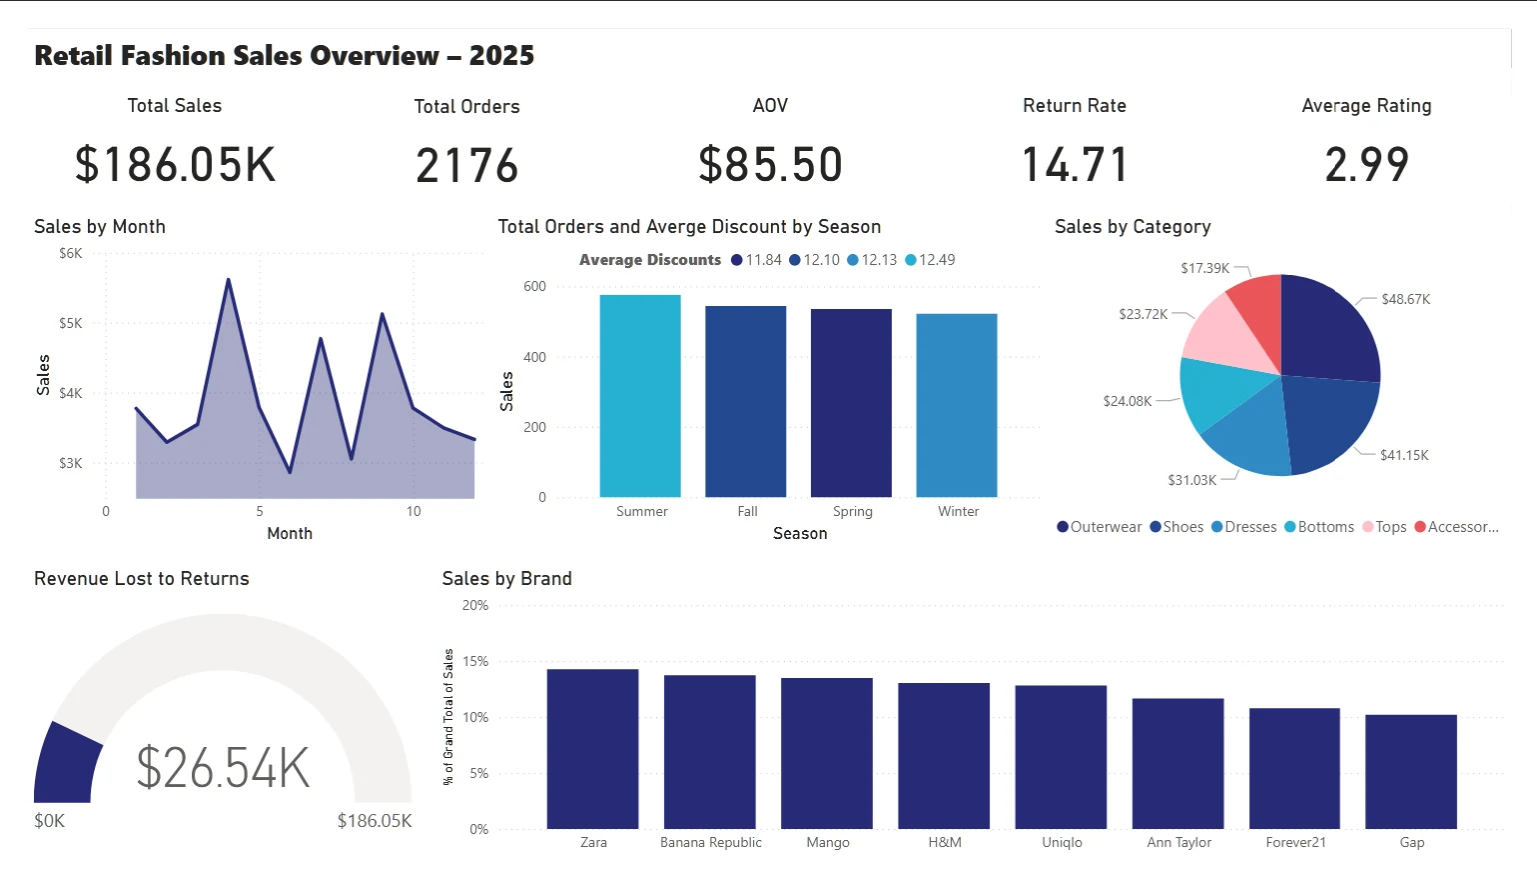
Revenue by Season, Seasonal Profit Margin, Return Rate by SeasonVisualizations
Sales Trends: Monthly/seasonal revenue (line chart)
Brand & Category Performance: Sales and profit (bar chart)
Discount Effectiveness: Discount vs sales (scatter plot)
Return Reasons: Category-wise distribution (pie chart)
Rating Distribution: Customer feedback histogram
Markdown Impact: Box plot of sales uplift after discount
Tools & Technologies
Python: Pandas, NumPy, Matplotlib, Seaborn
Data Visualization: Power BI
Data Source Management: CSV
Possible Extensions
Customer segmentation and loyalty scoring
Predictive return modeling (classification)
Seasonal demand forecasting
Dynamic pricing strategy evaluation
Summary
This project demonstrates the end-to-end data analytics lifecycle from cleaning and exploration to visualization and business insight generation in the context of retail fashion sales.
It highlights data-driven decision-making across pricing, sales strategy, and customer experience optimization.
Author: Muneeb Saddal
Tools Used: Python, Power BI, Excel, SQL
Dataset Source: Kaggle
Like this project
Posted Oct 16, 2025
Comprehensive analysis of retail fashion sales data for business insights.
Likes
1
Views
4