Sales Performance Dashboard Development
muneeb arshad
Sales Performance Dashboard
A multi-tool project demonstrating the full workflow of building a sales performance dashboard — starting with SQL queries, moving through Python analysis, and finally producing dashboards in both Excel and Power BI.
🔹 Part 1: SQL — Data Retrieval & Cleaning
Goal: Extract and clean sales data from a relational database.
Key Tasks:
Basic Queries
Count total number of orders.
Find distinct product categories sold.
Identify top 10 customers by total spend.
Aggregations
Calculate monthly revenue.
Find average order value (AOV).
Generate region-wise sales breakdown.
Joins (if additional tables like
products or customers are used)List customer names with their total revenue.
Find top 5 products by revenue in each region.
Export
Save cleaned outputs as SQL views or export to CSV for downstream analysis.
🔹 Part 2: Python — Analysis & Automation
Goal: Use Python for deeper analysis and automated data preparation.
Key Tasks:
Database Connection
Connect with
pandas + sqlalchemy and run SQL queries directly in Python.Data Cleaning
Handle missing values.
Convert dates to
datetime.Calculate total revenue per order (
quantity * price).Exploratory Analysis
Monthly revenue trend (line chart).
Revenue contribution by region (bar chart).
Top 10 products by sales (bar chart).
Advanced Analysis (Optional)
Customer segmentation (loyal vs. one-time buyers).
Forecast next month’s sales using a simple moving average.
Export
Save the cleaned and aggregated dataset into Excel for dashboarding.
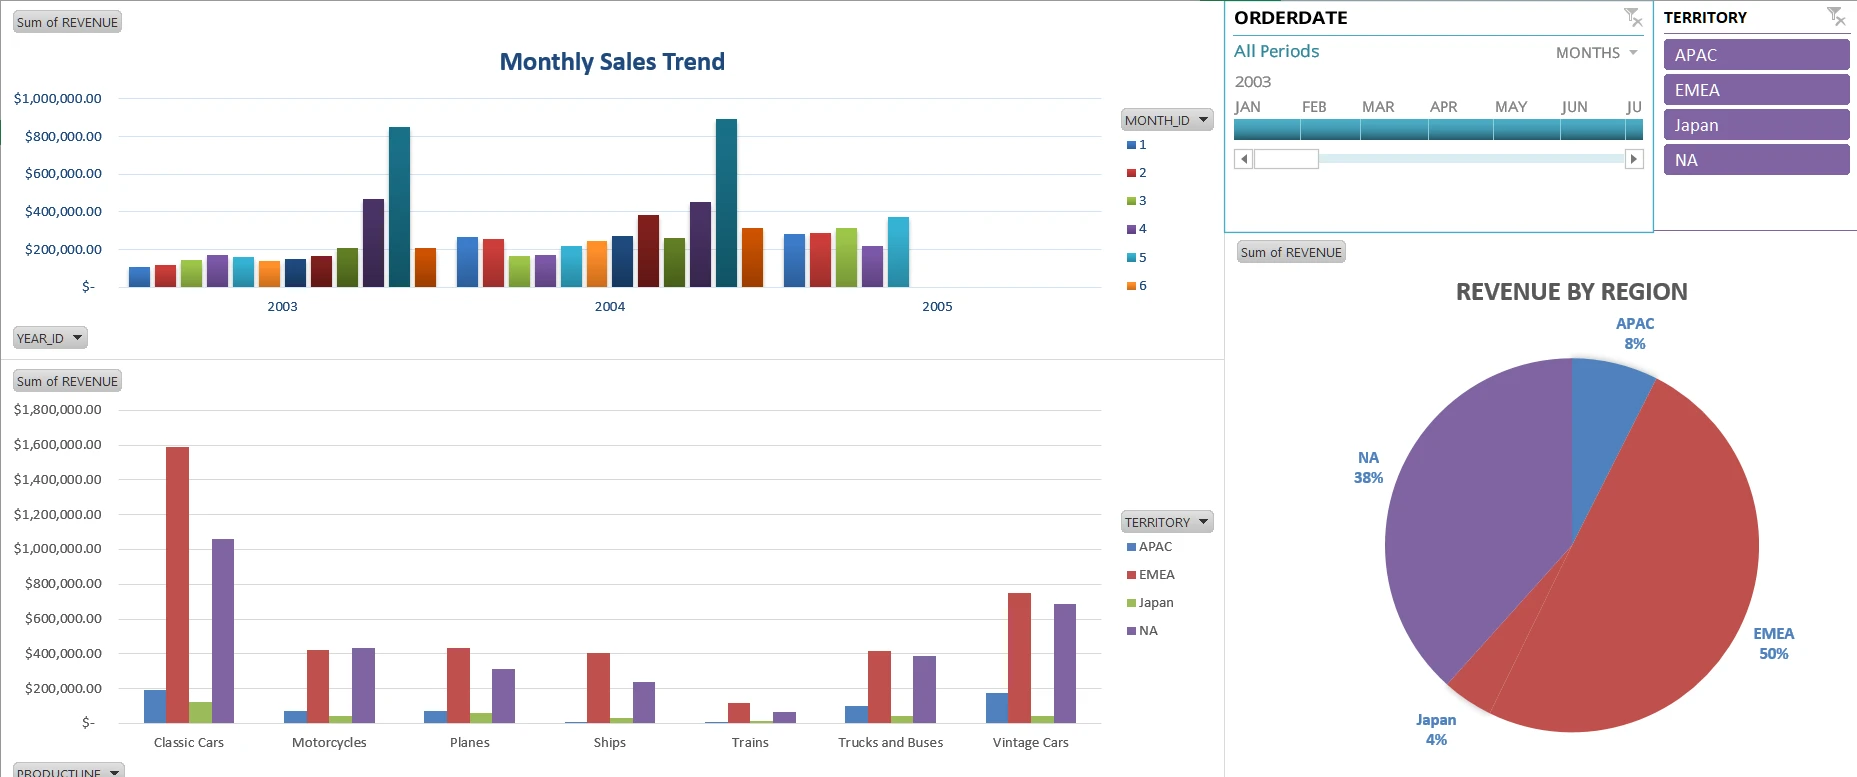
🔹 Part 3: Excel — Visualization & Dashboard
Goal: Build an interactive, stakeholder-friendly dashboard.
Key Tasks:
Import the processed Excel file from Python.
Create pivot tables for:
Monthly sales trend.
Sales by region.
Top 5 products.
Build visualizations:
Line chart for revenue trend.
Bar chart for products/regions.
Pie chart for region share.
Add interactive slicers & filters (year, region, product category).
Design a neat dashboard sheet suitable for managers/executives.
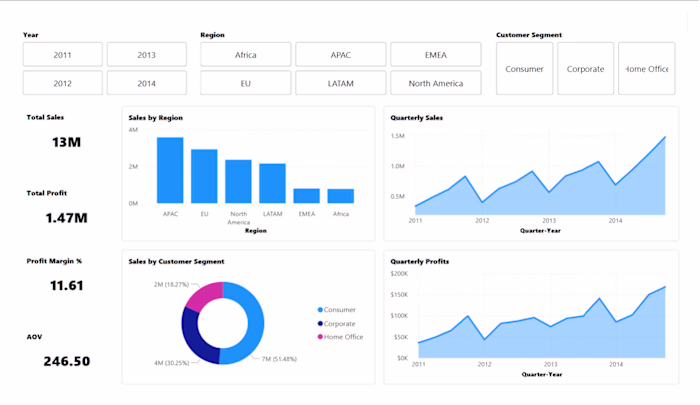
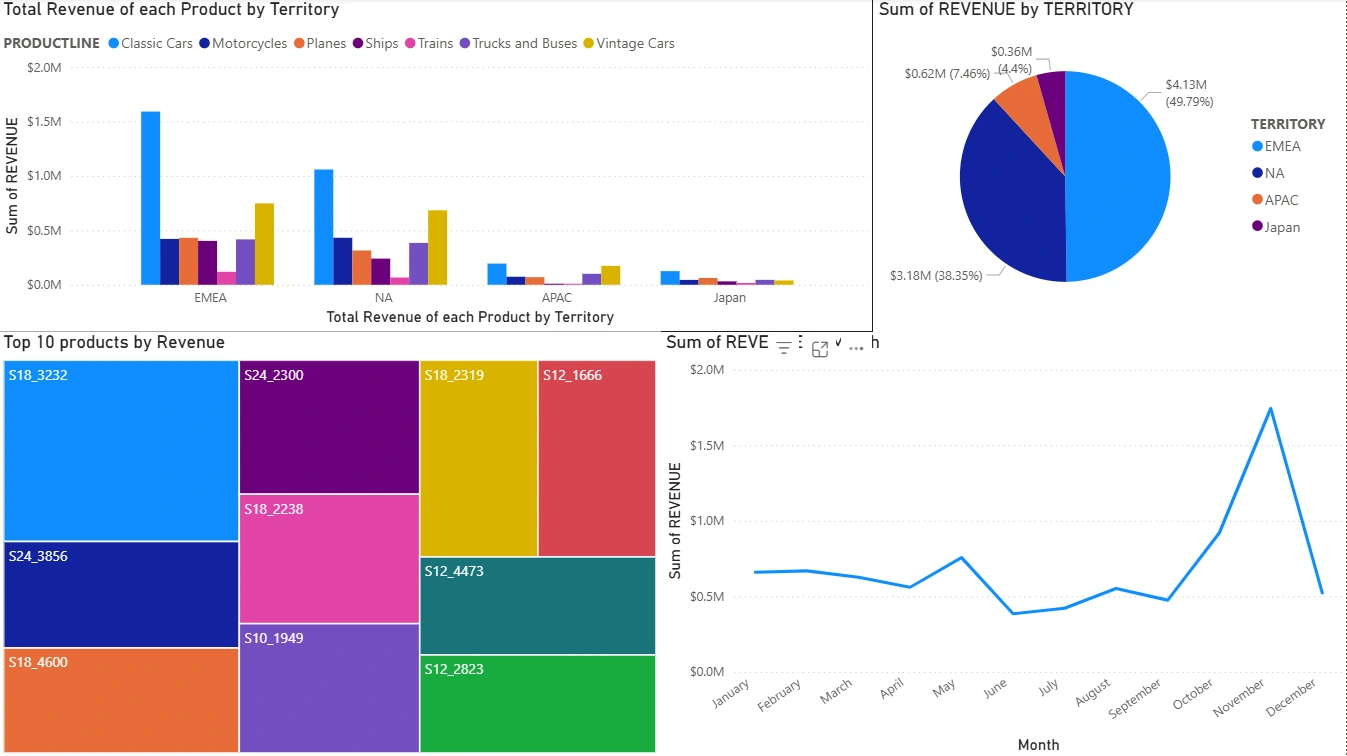
🔹 Part 4: Power BI — End-to-End Solution
Goal: Replicate the entire workflow in Power BI for a modern BI environment.
Key Tasks:
Data Import & Cleaning
Connect to raw sales dataset directly in Power BI.
Clean and transform using Power Query (M language).
Calculate measures with DAX (e.g., revenue, AOV, region-wise sales).
Visualizations
Monthly sales trend (line chart).
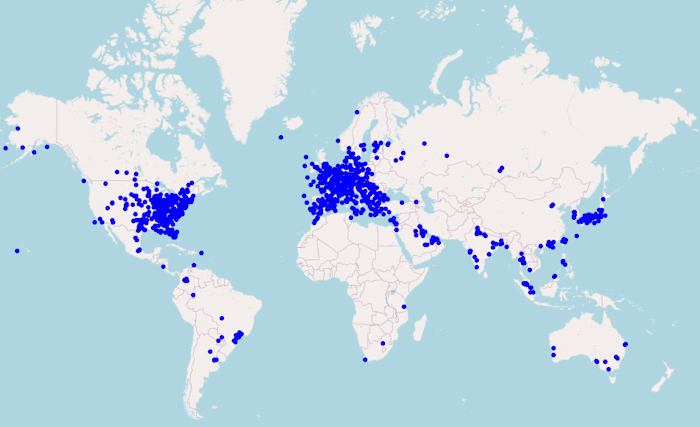
Sales by region (map & bar chart).
Top products (bar chart).
Customer breakdown.
Interactive Features
Add slicers for time, region, and product category.
Drill-through reports for detailed customer/product insights.
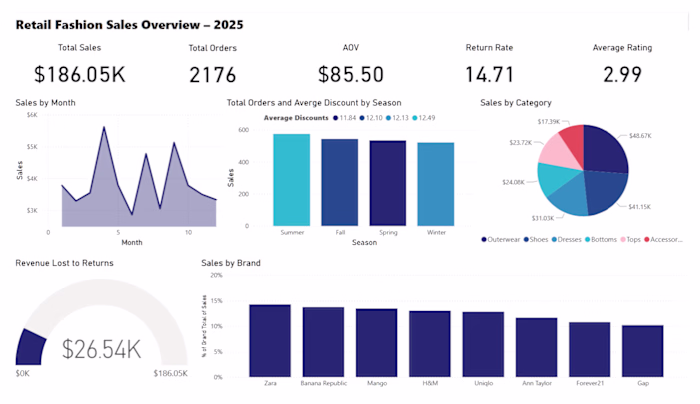
Dashboard Design
Professional, interactive dashboard replicating Excel’s insights in a dynamic Power BI report.
🔄 Workflow Simulation
Store raw data → SQL
Query & clean → SQL
Pull & analyze → Python
Export results → Excel
Build dashboard → Excel
Replicate end-to-end workflow → Power BI
📂 Deliverables
SQL scripts / queries
Python notebook (ETL + analysis)
Excel dashboard
Power BI report (.pbix file)
📸 Results & Insights
Python prediction
Excel dashboard snapshot

Like this project
Posted Oct 16, 2025
Developed a sales performance dashboard using SQL, Python, Excel, and Power BI.
Likes
0
Views
2