OpenSky Flight Data Analysis Project
muneeb arshad
OpenSky Flight Data Analysis
Analyzing and exploring live flight data obtained from the OpenSky API.
This project covers data ingestion, cleaning, visualization, and in-depth exploration of global flight activity.
Features & Components
Data Fetching & Storage
Retrieve live flight data using the OpenSky REST API.
Store retrieved data as structured CSV files for reproducibility.
Data Cleaning & Preprocessing
Handle missing and duplicate entries.
Convert timestamps to human-readable formats.
Normalize numerical features such as velocity, altitude, and latitude/longitude.
Exploratory Data Analysis (EDA)
Analyze global flight density and coverage areas.
Study altitude, velocity, and distance distributions.
Visualize temporal trends in flight activity (hourly, daily, weekly).
Detect outliers in flight parameters (extreme speeds, altitudes).
Country and region-based flight activity analysis.
Plot aircraft trajectories using latitude and longitude on interactive maps.
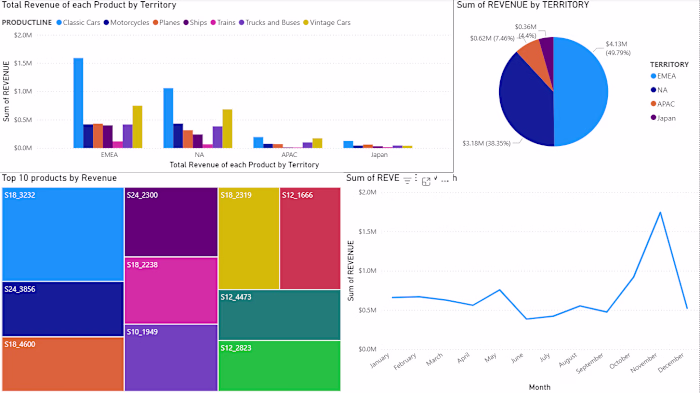
Visualization Tools
Static and interactive charts (Matplotlib, Plotly, Seaborn, Folium).
Heatmaps for flight density and velocity regions.
Correlation heatmaps to explore relationships among variables.
Insights & Analysis Performed
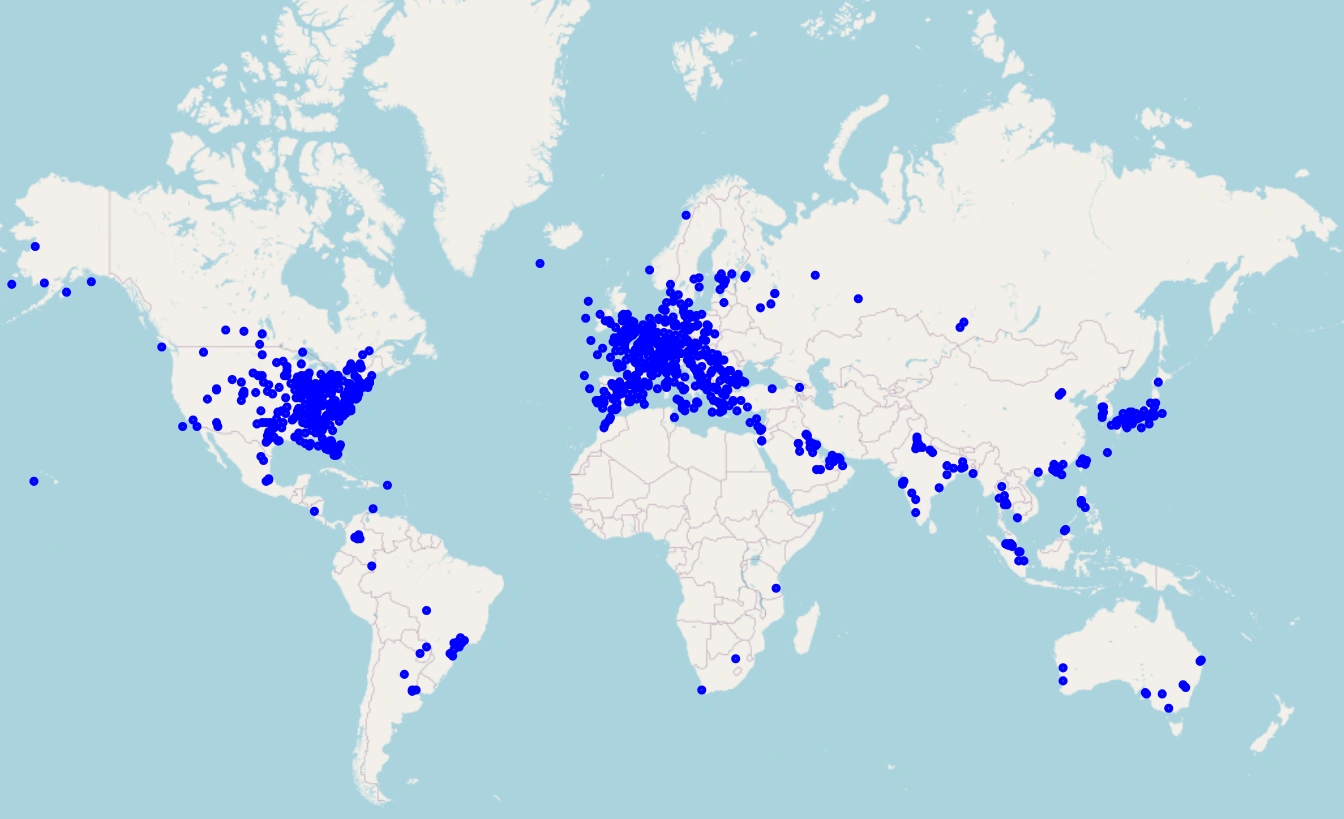
Geospatial Analysis
Mapping flight paths on world maps using latitude and longitude.
Heatmaps showing aircraft concentration by region.
Velocity & Altitude Analysis
Distribution of flight speeds and altitudes.
Identification of unusually high/low values.
Regional Activity
Flights grouped by origin country.
Top 10 countries by active flights and average velocity.
Correlation Study
Exploring relationships among flight attributes (velocity, altitude, geographic spread).
Key Findings
Certain regions exhibit denser flight clusters, especially near Europe and North America.
Average cruising altitude and speed patterns align with typical commercial aircraft ranges.
A small number of flights with abnormal velocity readings likely correspond to data anomalies or military flights.
Future Improvements
Add real-time visualization dashboards (Plotly Dash / Streamlit).
Combine OpenSky data with weather or airport delay datasets for contextual insights.
Automate data fetching and cleaning with a scheduler or Airflow pipeline.
Data Source & License
Data Source: OpenSky Network API
Like this project
Posted Oct 16, 2025
Analyzed global flight data using OpenSky API, visualized trends, and identified patterns.
Likes
0
Views
2