The network for creativity
Join 1.25M professional creatives like you
Connect with clients, get discovered, and run your business 100% commission-free
Creatives on Contra have earned over $150M and we are just getting started
Back to feedPost
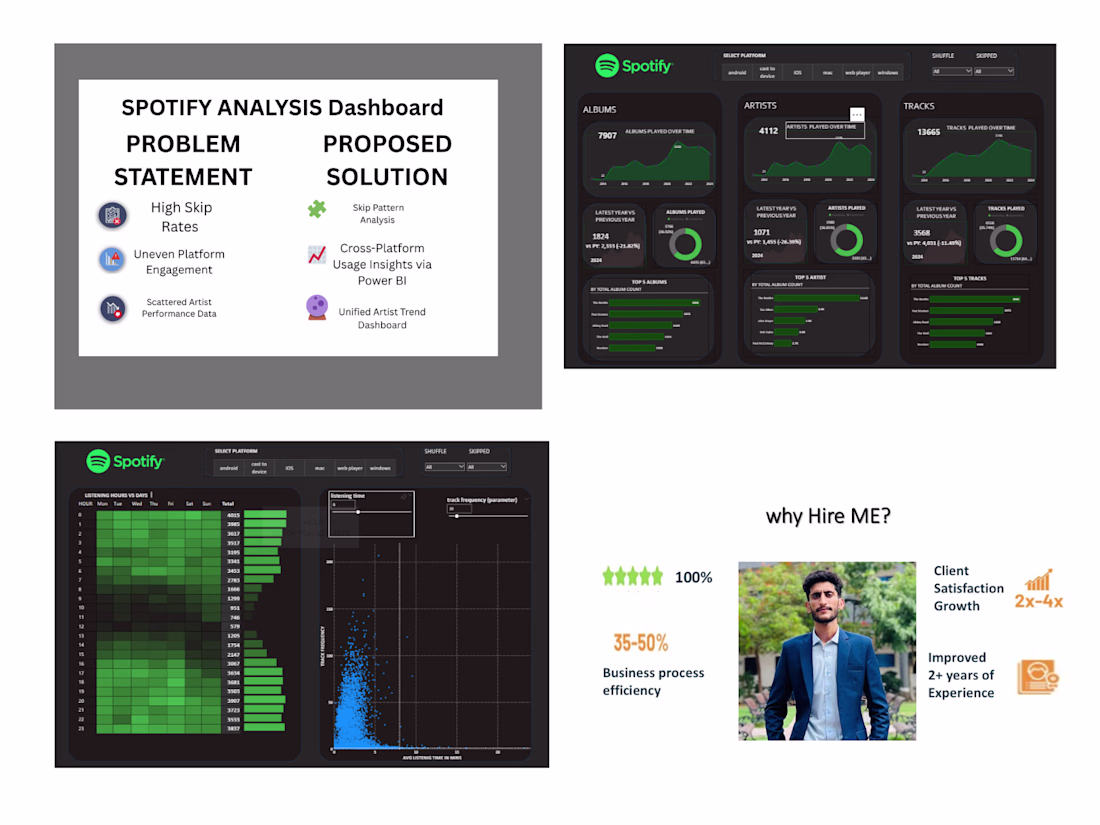
Spotify Analysis Dashboard
Turned raw Spotify streaming data into a clear, interactive dashboard that reveals how listeners actually engage with music.
Built in Power BI using SQL and DAX, this project explores user behavior across devices, identifies skip patterns, and highlights top-performing artists and tracks.
With dynamic visuals powered by key metrics like reason_start, reason_end, platform, and ms_played, the dashboard uncovers:
• Why users skip songs or stop playback
• Which platforms drive the most engagement
• Which artists and albums perform best by time and device
Perfect for music analysts, record labels, or streaming teams who want actionable insights into listener habits and engagement trends.
The network for creativity
Join 1.25M professional creatives like you
Connect with clients, get discovered, and run your business 100% commission-free
Creatives on Contra have earned over $150M and we are just getting started
Trending
Claude
Claude has entered the design space. How are you using Claude Design?
Contra University
Learn from expert creatives how to earn more using next-gen AI tools.
MagicPath
The canvas is infinite, and exploration is becoming the workflow. How are you using MagicPath?
creativeaiflow
Creative AI workflows are evolving. What tools do you use, and what are their strengths and weaknesses?
freelancerlife
Freelancer life is wins, pivots, and everything in between. What’s yours right now?