The network for creativity
Join 1.25M professional creatives like you
Connect with clients, get discovered, and run your business 100% commission-free
Creatives on Contra have earned over $150M and we are just getting started
Back to feedPost
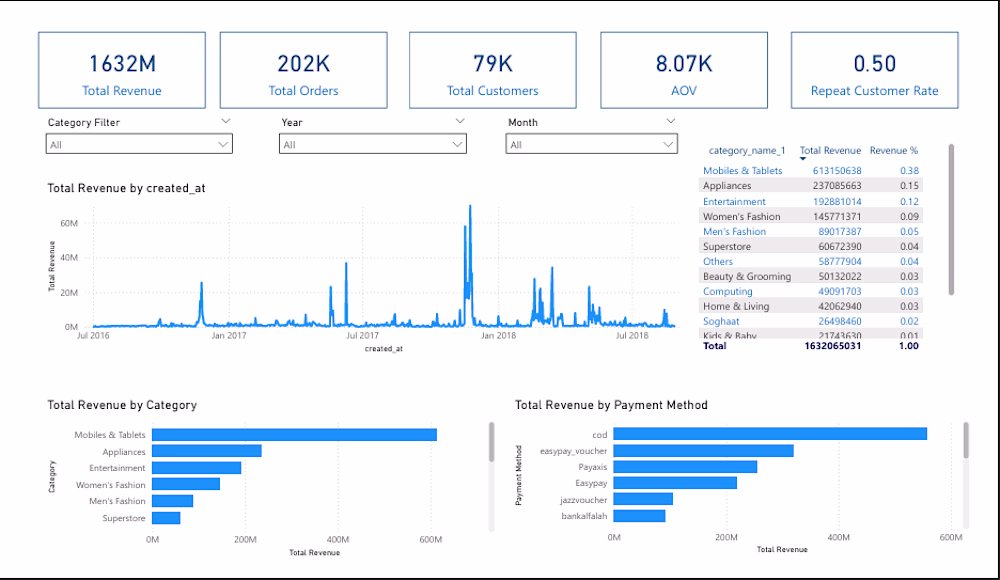
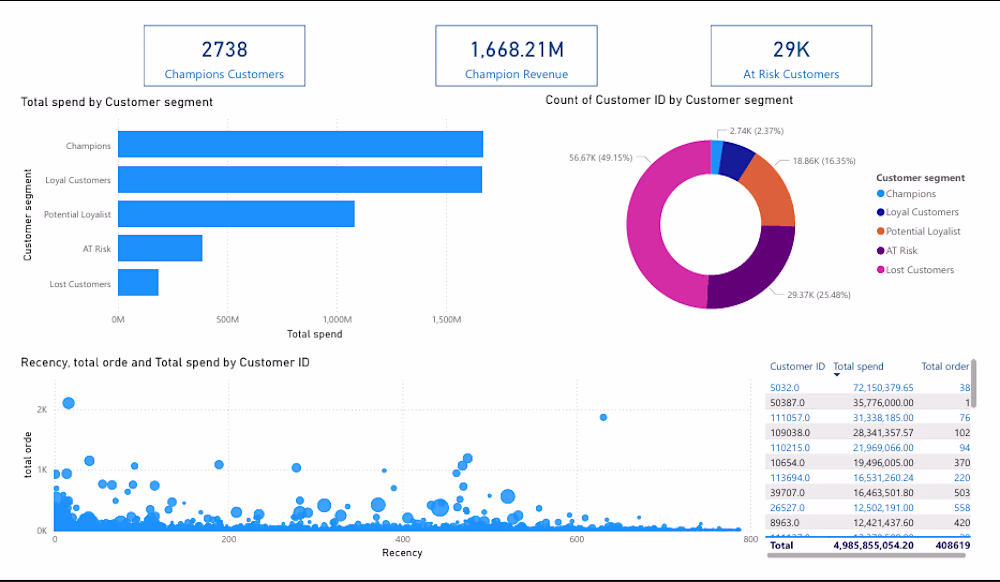
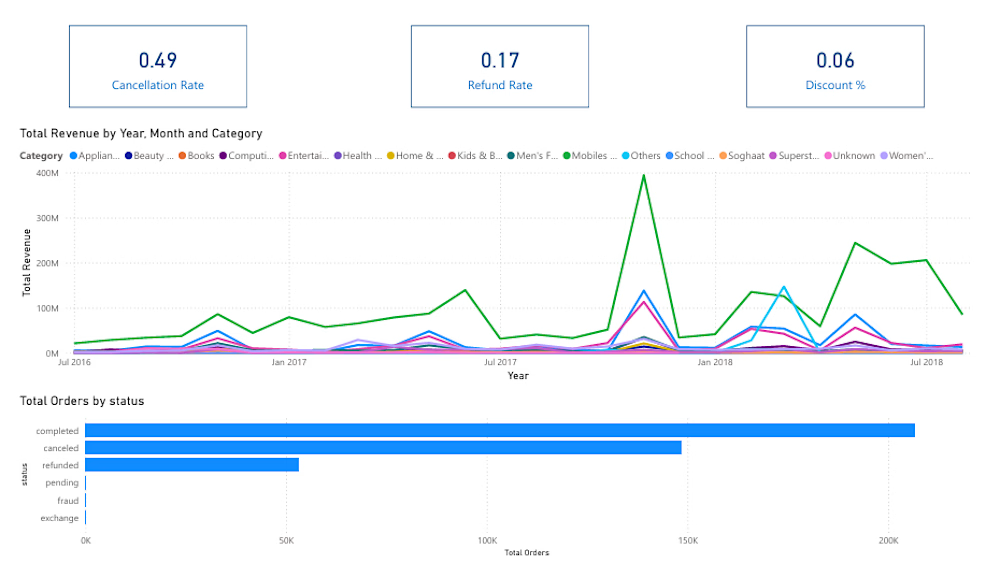
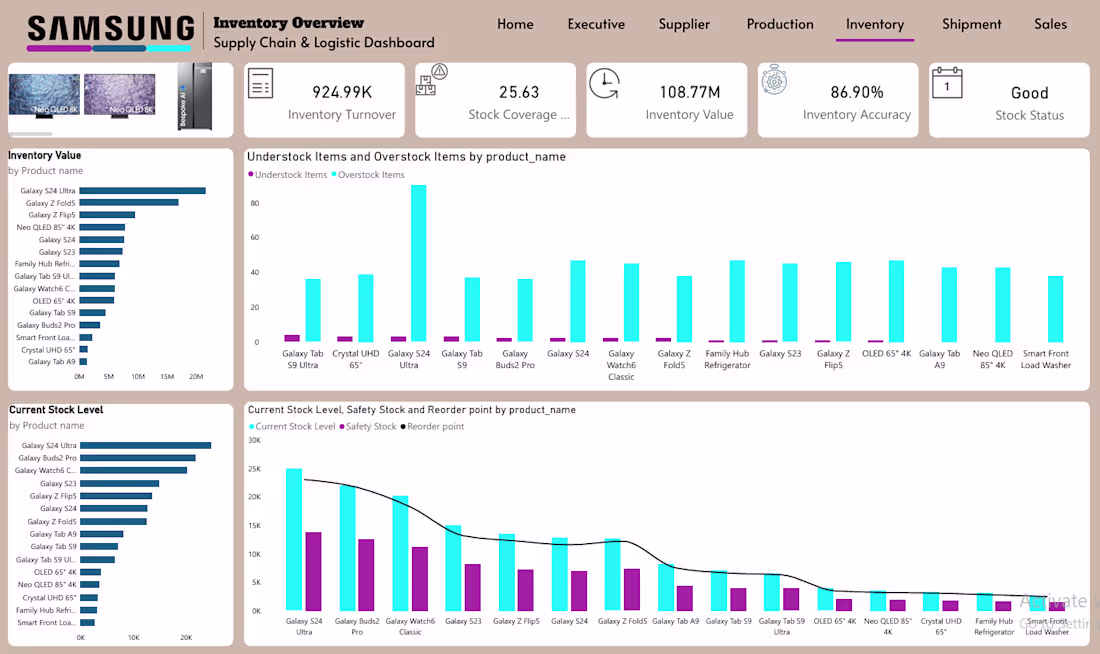
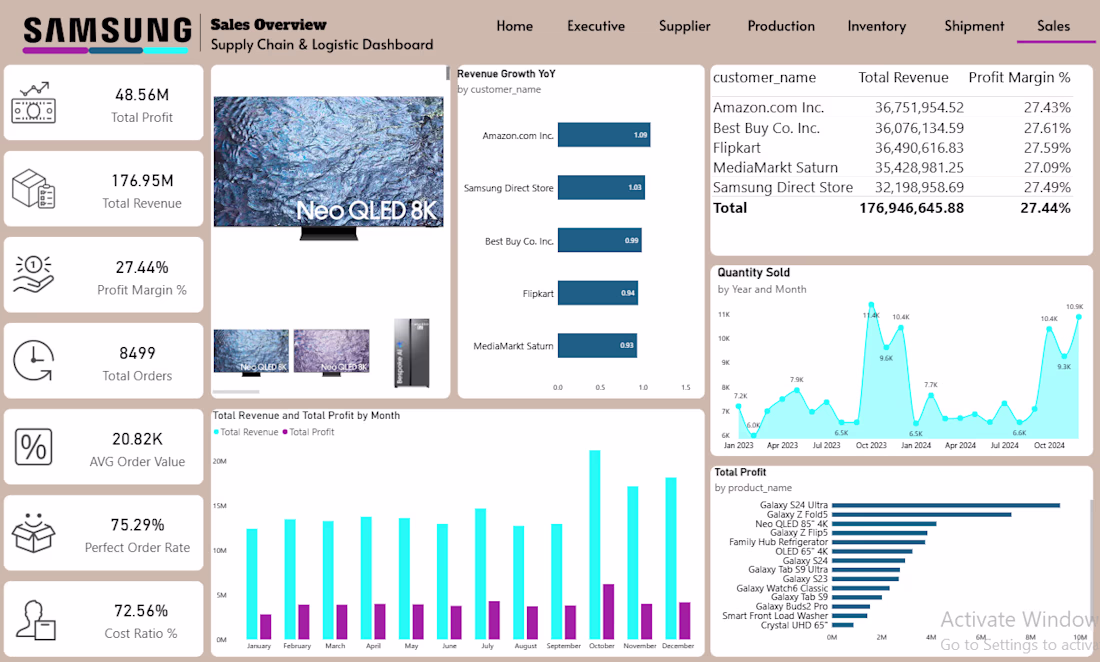
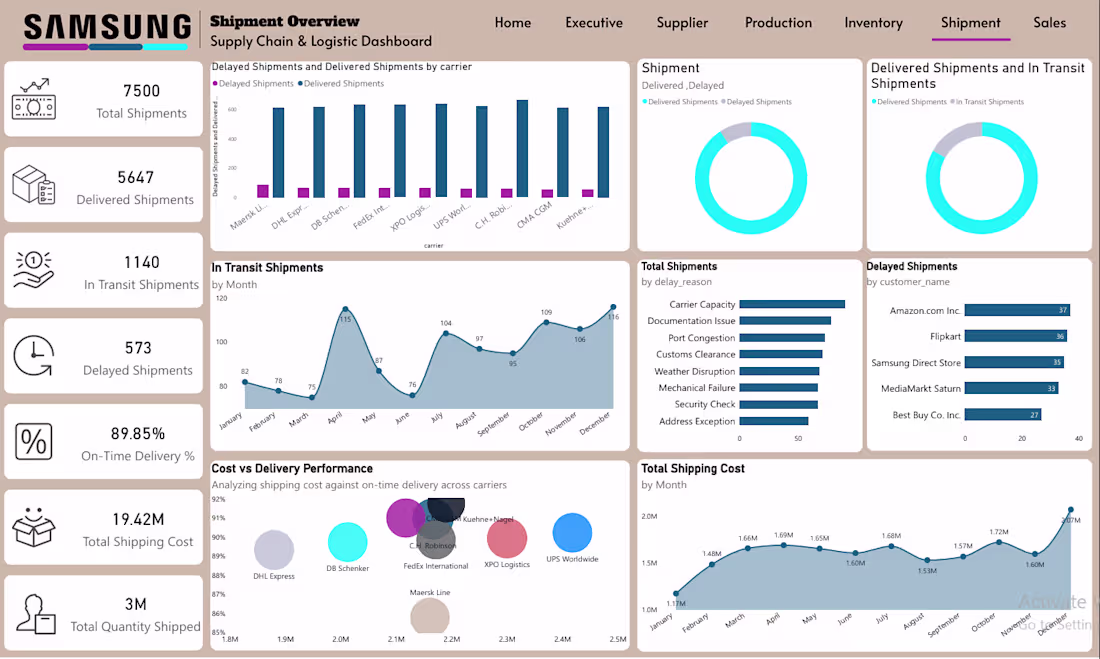
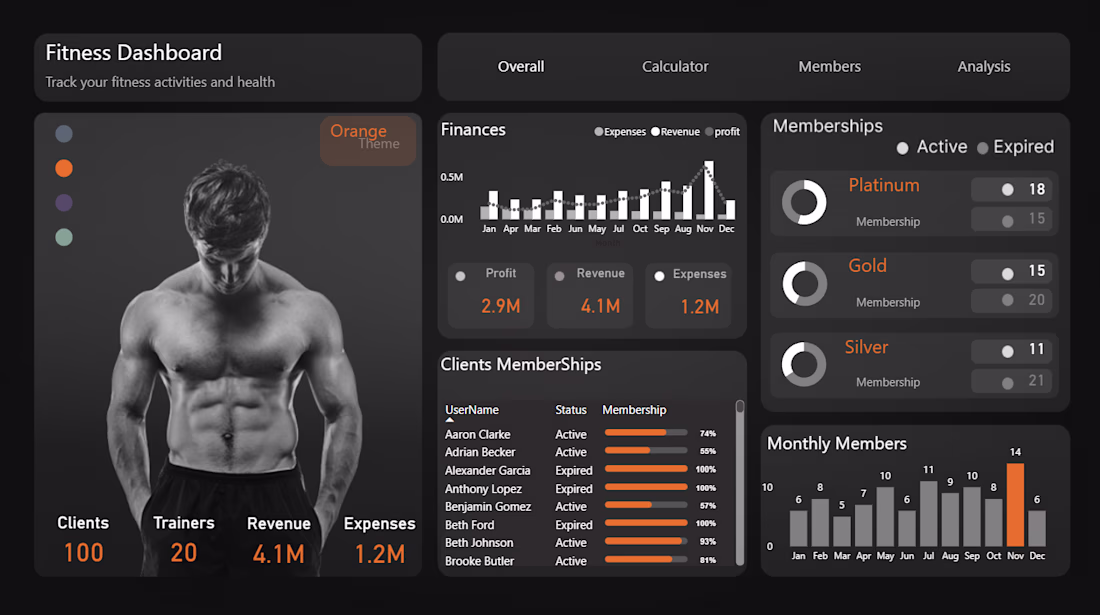
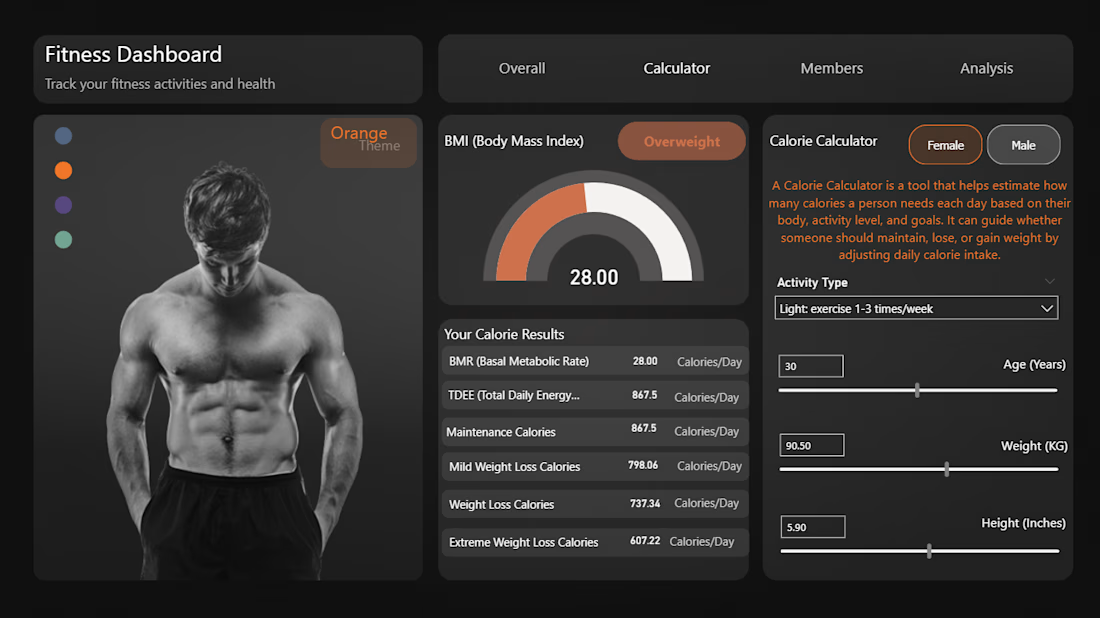
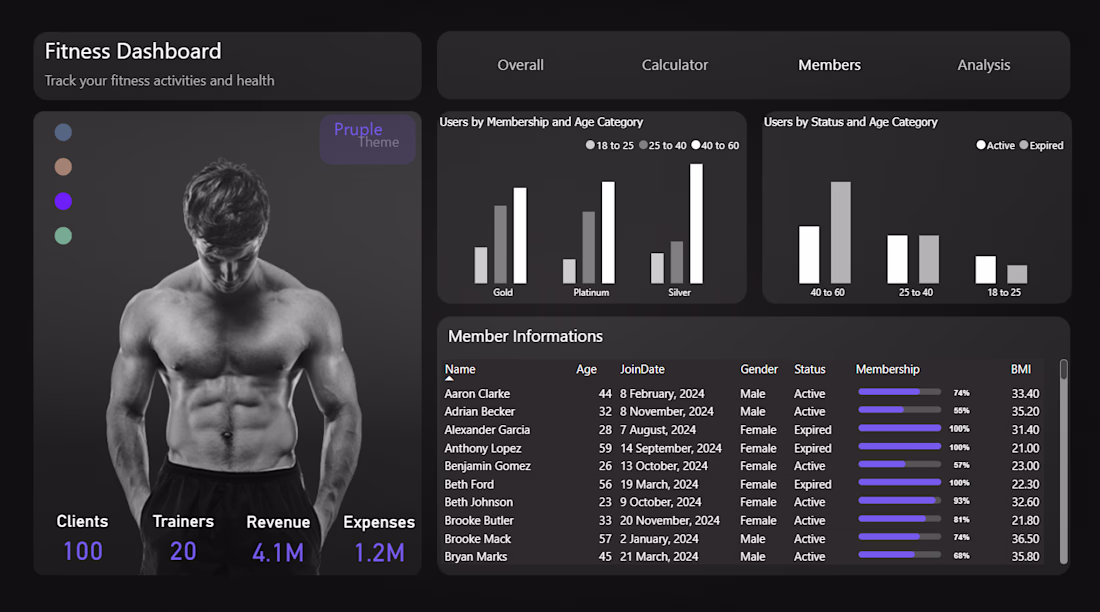
I build an interactive e-commerce analytics dashboard using Power BI.
The dataset was cleaned and prepared using Python (Pandas) and transformed into meaningful business insights through data visualization and KPI analysis.
The dashboard tracks sales performance, revenue trends, and product category performance while also identifying customer segments using RFM analysis.
It helps business understand customer behavior and make data-driven decisions.
still room for some more improvement, but keep up the good work
Thank you for the feedback!
Could you please let me know what areas I could improve?
1. Keep the layout clean
Use a clear grid layout with proper spacing and alignment. Avoid overcrowding visuals.
2. Use a consistent color palette
Stick to 2–3 main colors and use neutral backgrounds. Use accent colors only to highlight important metrics.
3. Highlight key...
Thanks, Istiak, for taking the time to give me feedback.
I’ll work on improving
The network for creativity
Join 1.25M professional creatives like you
Connect with clients, get discovered, and run your business 100% commission-free
Creatives on Contra have earned over $150M and we are just getting started
Related posts
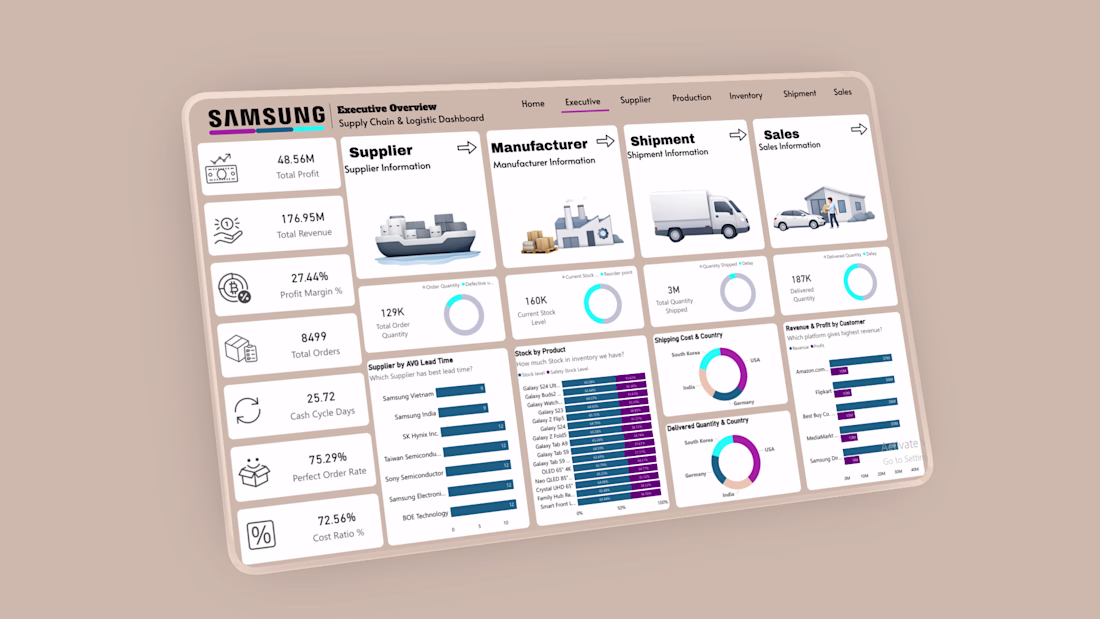
Supply Chain
This project presents an end-to-end Supply Chain Analytics Dashboard built using Power BI. It provides a comprehensive analysis of business operations across Sales, Inventory, Production, Procurement, and Shipment. The goal is to transform raw data into actionable insights that support data-driven
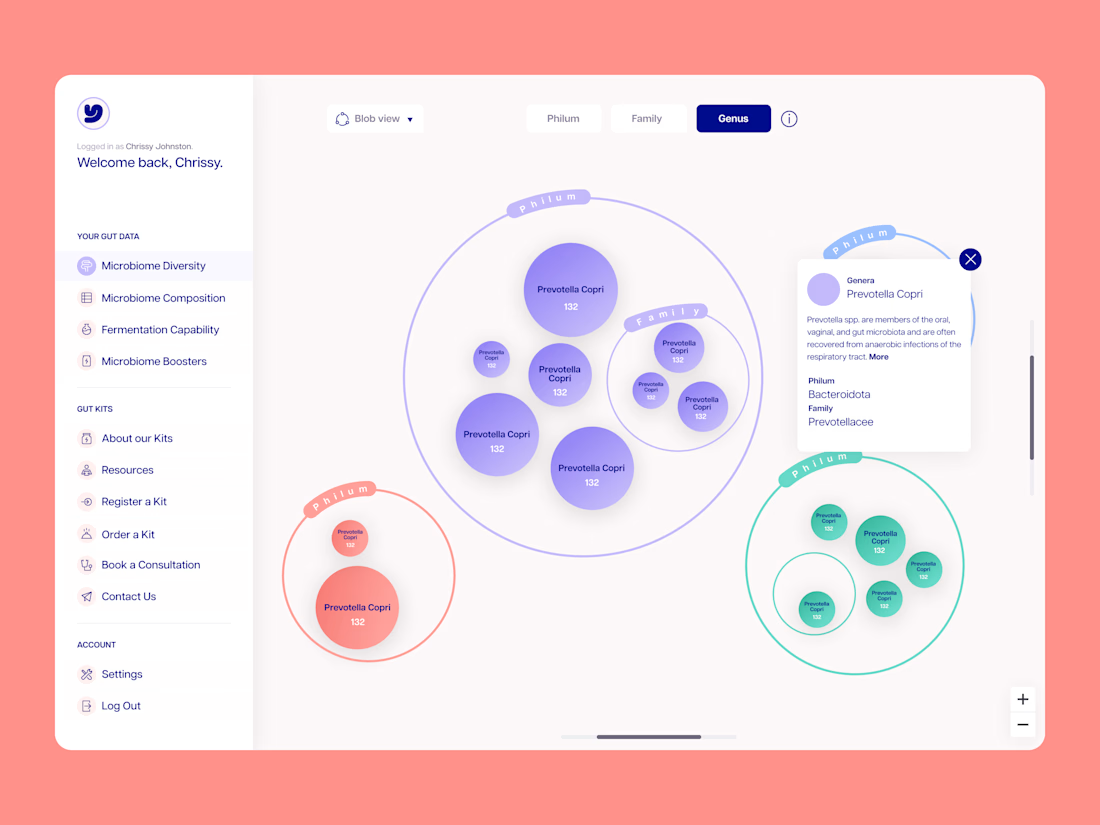
A little throwback to some Dashboard/Data work I was doing for Myota a while back! Still love the side nav
Good work

Trending
Claude
Claude has entered the design space. How are you using Claude Design?
Contra University
Learn from expert creatives how to earn more using next-gen AI tools.
creativeaiflow
Creative AI workflows are evolving. What tools do you use, and what are their strengths and weaknesses?
portfolioreview
The best portfolios tell a story, not just show a grid. Share yours for feedback.
freelancerlife
Freelancer life is wins, pivots, and everything in between. What’s yours right now?