
Farah Maqbool
ML engineer helping startups turn data into insights.
New to Contra
Farah is ready for their next project!
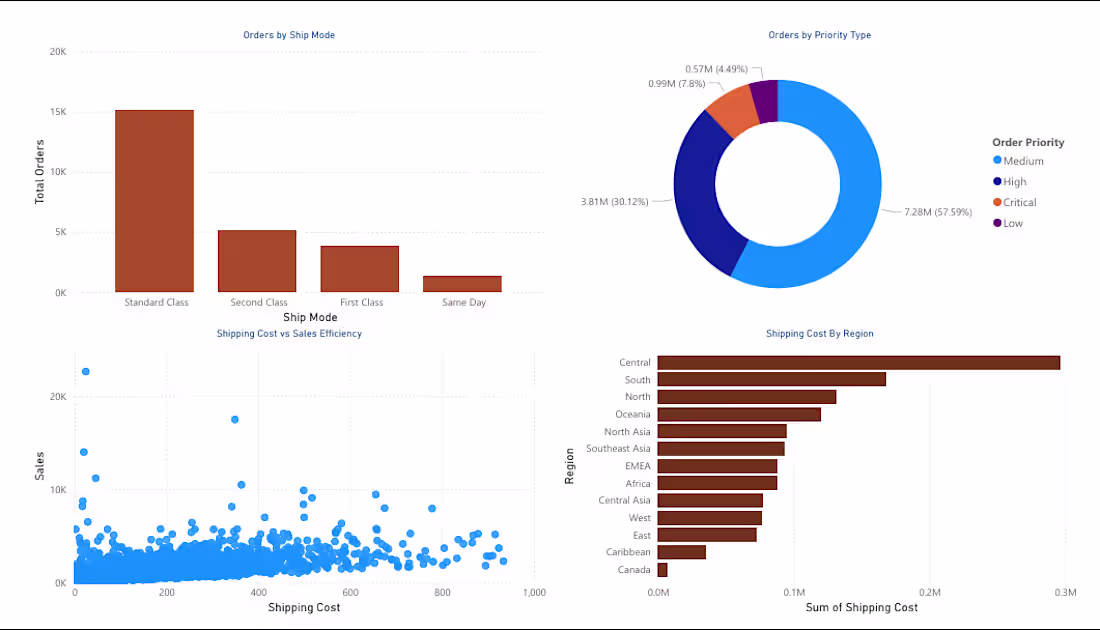
I Designed a comprehensive Business Intelligence reporting system using Power BI to analyze sales, profitability, customer behavior, and operational efficiency.
The dashboard integrates multiple analytical layers, including executive KPIs, product-level insights, customer segmentation, and logistics performance. Advanced visualizations such as scatter plots, treemaps, heatmaps, and waterfall charts were used to uncover hidden patterns and support data-driven decision-making.
This project demonstrates the ability to transform raw transactional data into a structured, multi-page BI solution suitable for real-world business reporting.
0
25
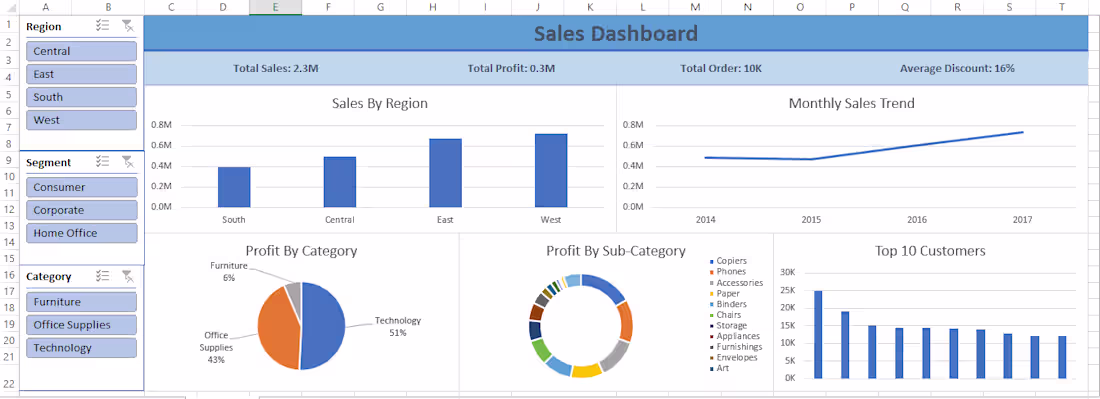
I Developed an interactive Excel dashboard to analyze sales performance, profitability, and customer behavior using transactional retail data.
The dashboard enables quick insights into regional performance, monthly trends, product profitability, and high-value customers.
Key metrics such as total sales, total profit, total orders, and average discount are highlighted using KPI indicators, while dynamic slicers allow users to filter the analysis by region, customer segment, and product category.
The project demonstrates the ability to transform raw business data into clear and actionable insights using spreadsheet analytics.
0
37
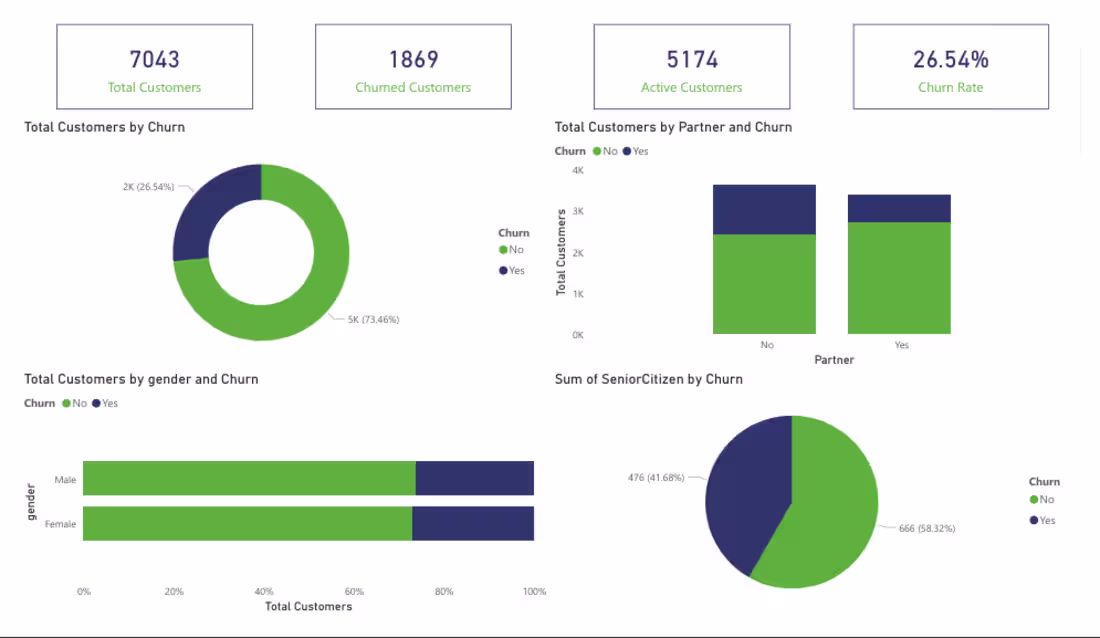
Customer Retention & Churn Analysis Dashboard
0
1
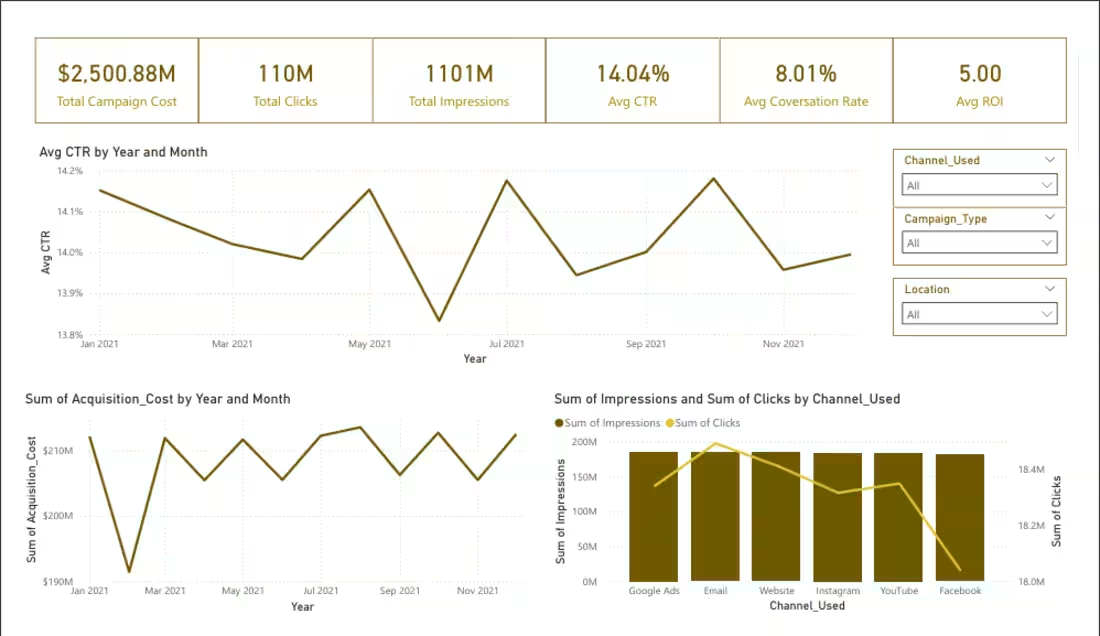
I Designed an interactive Marketing Campaign Performance Dashboard using Power BI to analyze campaign effectiveness across channels, companies, and audience segments.
The dashboard tracks key metrics such as clicks, impressions, CTR, conversion rate, ROI, and acquisition cost.
It helps identify:
High-performing channels
Compare campaign results
Understand audience engagement
Enabling data-driven marketing decisions
Through clear and interactive visualizations.
0
69
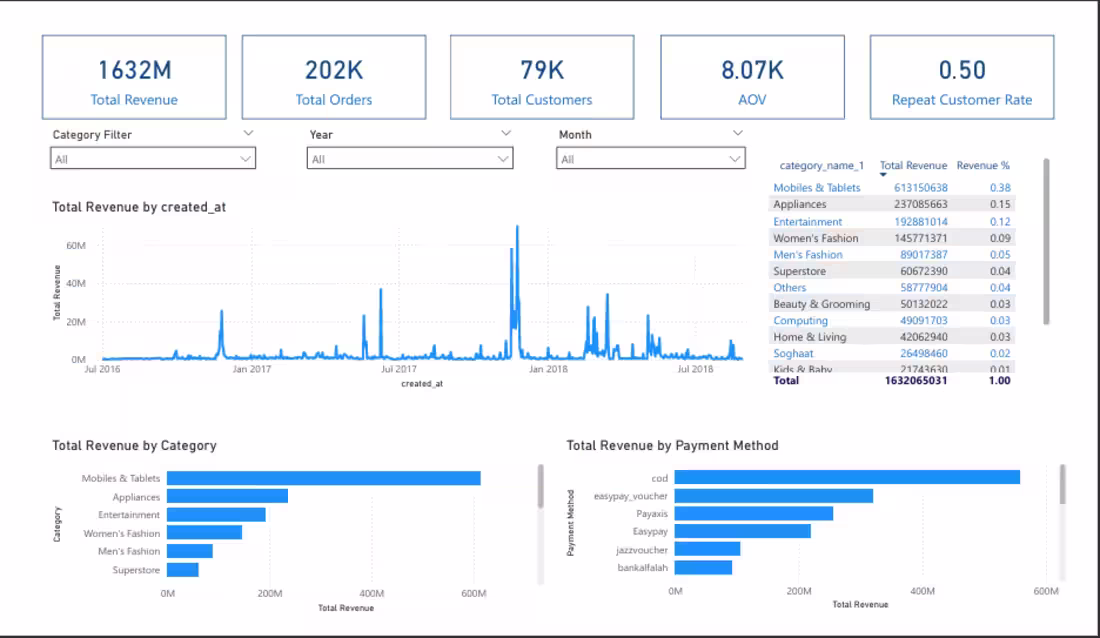
I build an interactive e-commerce analytics dashboard using Power BI.
The dataset was cleaned and prepared using Python (Pandas) and transformed into meaningful business insights through data visualization and KPI analysis.
The dashboard tracks sales performance, revenue trends, and product category performance while also identifying customer segments using RFM analysis.
It helps business understand customer behavior and make data-driven decisions.
4
2
122